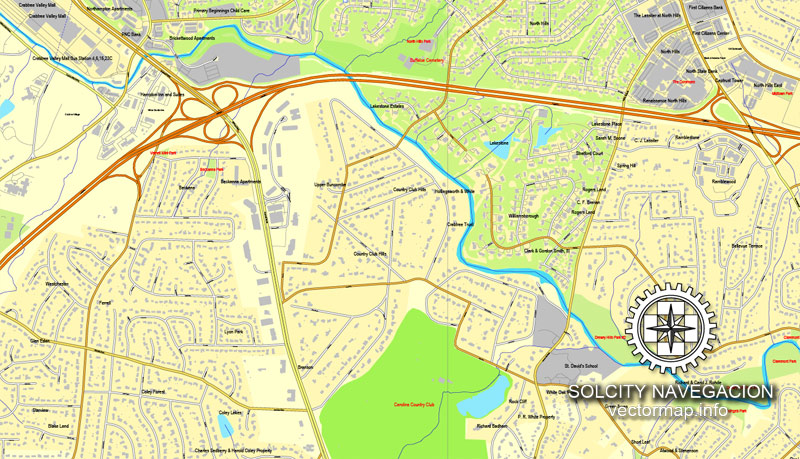
Raleigh, Chapel Hill, Durham, North Carolina, US printable vector street City Plan map, full editable, Adobe PDF, full vector, scalable, editable, text format street names, 53 mb ZIP
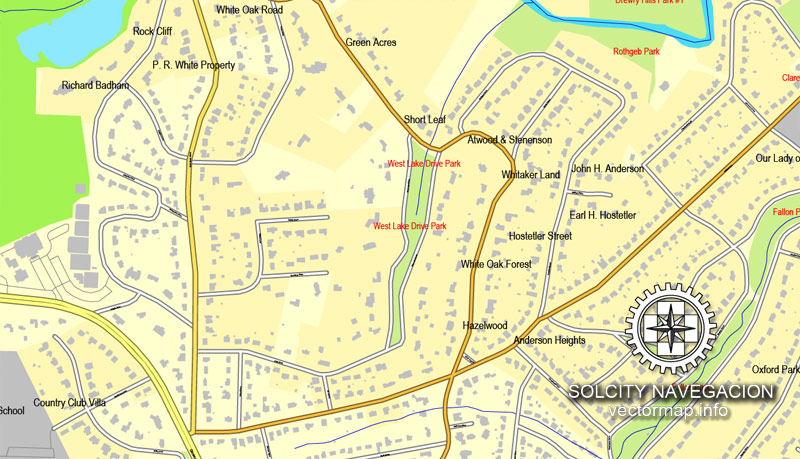
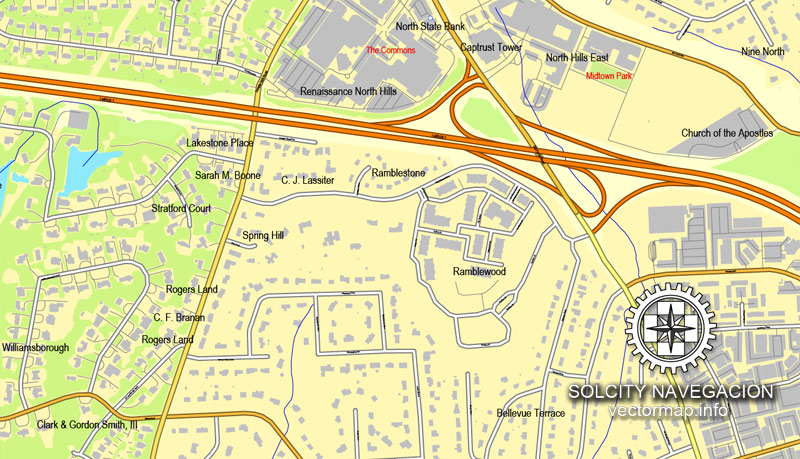
All streets, some buildings. Map for design, print, arts, projects, presentations.
You can edit this file by Adobe Illustrator, Adobe Acrobat, Corel Draw.
DWG, DXF, CDR and other formats – on request, same price, please, contact
Raleigh + Chapel Hill + Durham, North Carolina, USA.
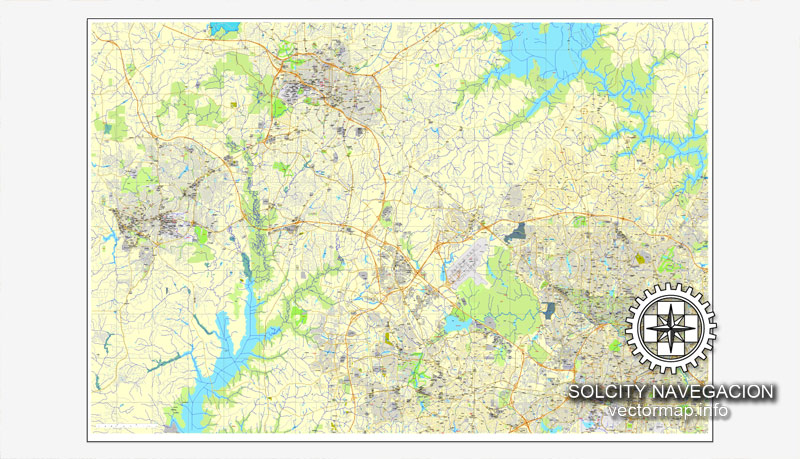
This vector map of Raleigh city is used as a basis for design, editing, and further printing.
This is the most detailed, exact map of Raleigh city for high-quality printing and polygraphy. You can always clarify the map development date by contacting us.
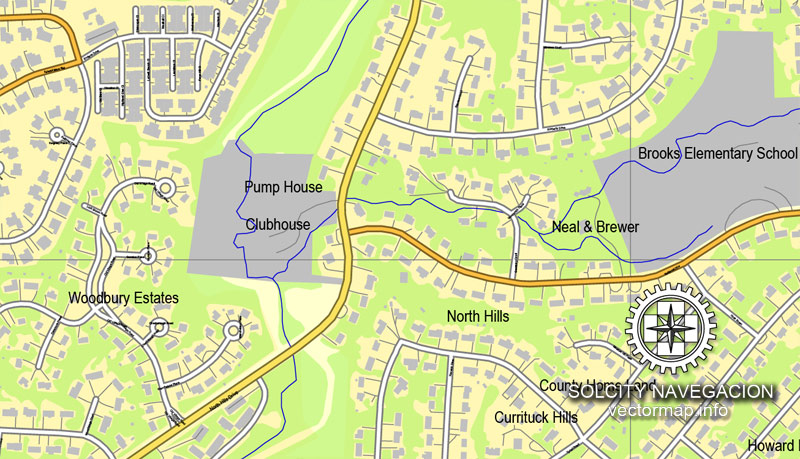
For your convenience, all objects on Raleigh vector city map are divided into layers. And the editing is very easy – colors, lines, etc.
You can easily add any objects needed (e.g. shops, salons, sale points, gas station or attraction) on any layer of Raleigh vector map.
Raleigh is the capital of the state of North Carolina and the seat of Wake County in the United States. Raleigh is the second-largest city in the state, after Charlotte. Raleigh is known as the “City of Oaks” for its many oak trees, which line the streets in the heart of the city. The city covers a land area of 142.8 square miles (370 km2). The U.S. Census Bureau estimated the city’s population as 464,758 as of July 1, 2017. It is one of the fastest-growing cities in the country. The city of Raleigh is named after Sir Walter Raleigh, who established the lost Roanoke Colony in present-day Dare County.
One of the advantages of Raleigh city vector maps of our production is the relevance of cartographic data, we constantly update all our products.
This vector map of Raleigh city is used by:
designers, layout designers, printers, advertisers and architects. Our product – vector maps – is designed for further editing and printing in large formats – from @Wall format (a few meters) to A-0 and A-1, A-2, A-3.
The Raleigh city map in vector format is used for design, urban planning, presentations and media visualizations.
The advertising and presentation map of Raleigh city (usually the final designer marks the routes, and puts the client’s objects (shops, saloons, gas stations etc.)
The undoubted advantage is that people will NEVER throw out this advertising product – the map. In fact, as an advertising medium, a city map is the most “long-playing” of the well-known polygraphic advertising media, with the longest lifespan, and the maximum number of interactions with the customer.
For travelers, maps are sold at the airports and gas stations around the world. Often the source is our vector maps.
Take a look, who purchases our vector maps of Raleigh city in “Our Clients and Friends” page – these are large and small companies, from super-brands like Volvo and Starbucks, to small design studios and printing houses.
It’s very easy to work with vector maps of Raleigh city, even for a not very experienced designer who can turn on and off the map layers, add new objects, change the colors of fill and lines according to customer requirements.
Raleigh is home to North Carolina State University (NCSU) and is part of the Research Triangle Park (RTP) area, together with Durham (home of Duke University) and Chapel Hill (home of the University of North Carolina at Chapel Hill). The “Triangle” nickname originated after the 1959 creation of the Research Triangle Park, located in Durham and Wake counties, among the three cities and their universities. The Research Triangle region encompasses the U.S. Census Bureau’s Raleigh-Durham-Chapel Hill Combined Statistical Area (CSA), which had an estimated population of 2,037,430 in 2013. The Raleigh metropolitan statistical area had an estimated population of 1,214,516 in 2013.
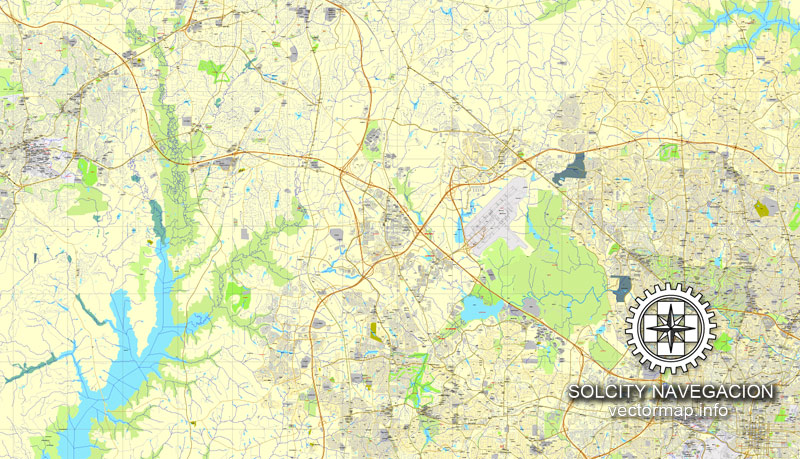
The undoubted advantage of Raleigh city vector maps in printing is an excellent and detailed visualization, when customer can expand a large paper map and instantly define his location, find a landmark, an object or address on map, unlike using the popular electronic formats of Google and Yandex maps for example.
Printable vector maps of Raleigh city are much more convenient and efficient than any electronic maps on your smartphone, because ALL DETAILS are displayed in the entire space of Raleigh city map.
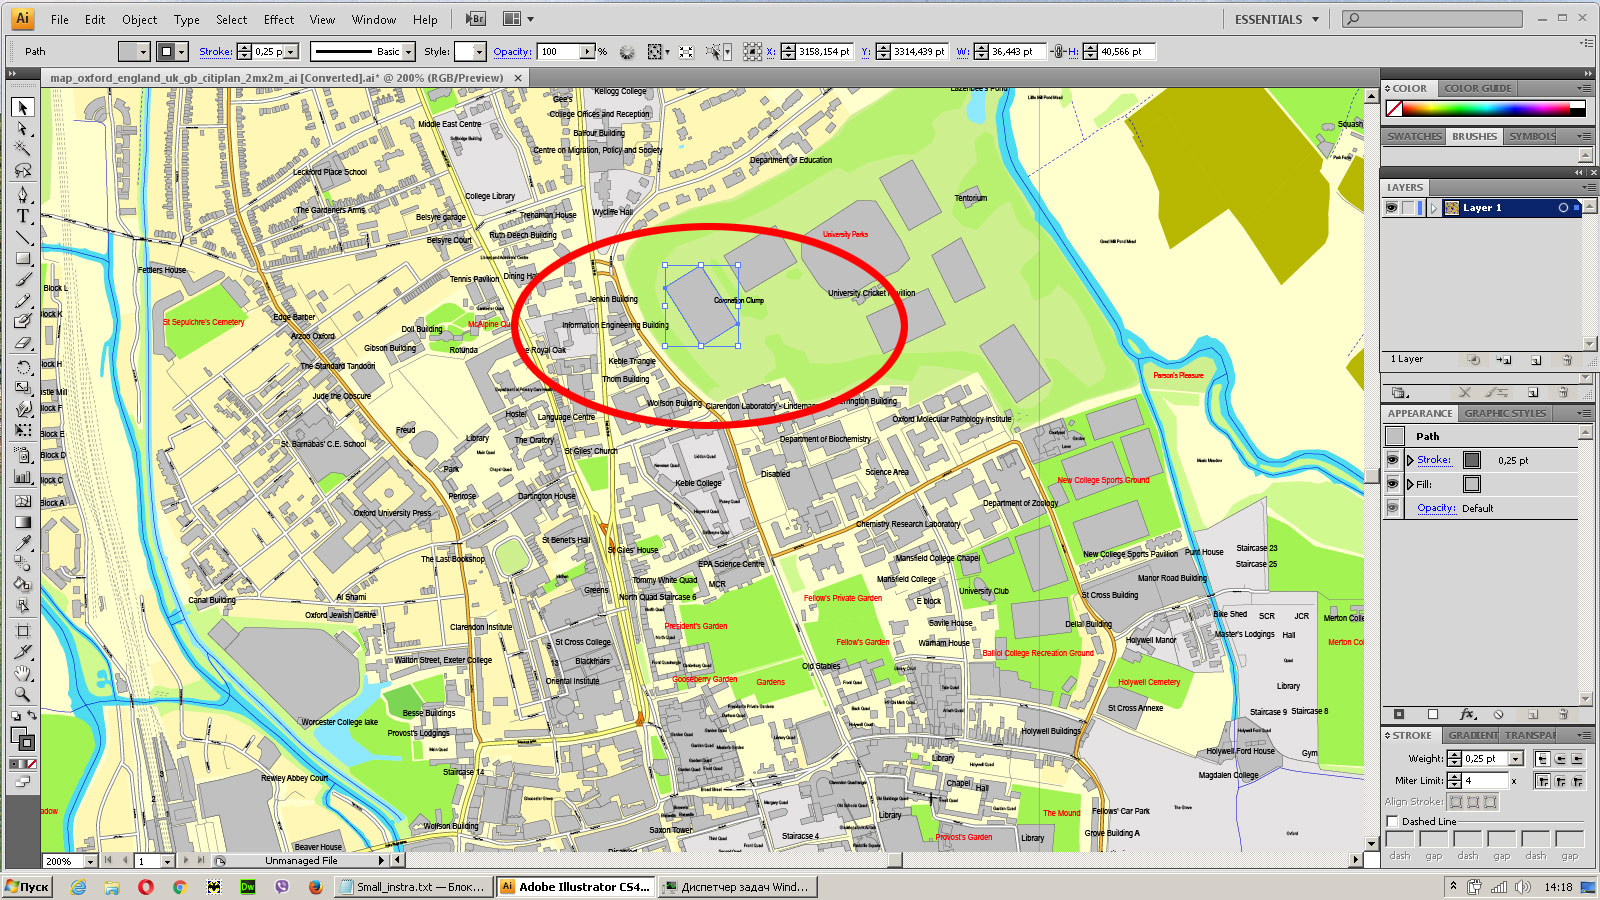
Useful tips on working with vector maps of cities and countries in Adobe Illustrator.
«V» – launches the Selection tool (cursor, black arrow), which makes active any vector line.
«А» – launches the Direct Selection tool (white cursor), allows you to select curve elements and drag them to the desired place.
«R» – activates the Rotate tool, which helps you rotating selected objects around the center point by 360 degrees.
«E» – gives you the opportunity to use the Eraser tool and erase unnecessary parts.
«X» – switches between Fill and Stroke in the Tools section. Try to get used to this hot key and
you will quickly understand that you can’t live and work without it.
Most of Raleigh is located within Wake County, with a very small portion extending into Durham County. The towns of Cary, Morrisville, Garner, Clayton, Wake Forest, Apex, Holly Springs, Fuquay-Varina, Knightdale, Wendell, Zebulon, and Rolesville are some of Raleigh’s primary nearby suburbs and satellite towns.
Guides are not limited to vertical and horizontal in Adobe Illustrator. You can also create a diagonal guide for example. Moreover, you can turn any contours into guides. Select the outline and go to View > Guides > Make Guides (Create Guides), or simply press Cmd/Ctrl + 5. You can also turn the guides back into an editable object. Go to menu, View > Guides > Unlock Guides (Release Guides), select the guide you want to edit and select View > Guides > Release Guides (Reset Guides), or just press Cmd/Ctrl + Option / Alt + 5).
You will probably want to change the color scheme used on our Raleigh vector city map.
To quickly and effectively play with colors.
Of course, you can do it manually, all objects in our Raleigh city vector map are divided according to types and layers, and you can easily change the color gamma of vector objects in groups and layers.
Raleigh is an early example in the United States of a planned city. Following the American Revolutionary War when the US gained independence, this was chosen as the site of the state capital in 1788 and incorporated in 1792 as such.
But there is more effective way of working with the whole VECTOR MAP of Raleigh city and all layers:
The overview dialog «Edit colors»/«Repaint Graphic Object» (this dialog box name can change depending on the context):
If you have selected a part or a layer of Raleigh city vector map and open the dialog box by clicking the icon in the Control panel, on the Samples palette or the Color Catalog, or if you choose Edit > Edit Colors> Repaint Graphic Object, then the «Repaint Graphic Object» dialog box appears, and you get access to «Assign» and «Edit» tabs.
If a picture or a map fragment is not selected, and you open the dialog box by clicking the icon in the Control panel, on the Samples palette or in the Color Catalog, the «Edit Colors» dialog box appears and you can only access the «Edit» tab.
Regardless of the name at the top of the dialog box, the right-hand side always displays the color group of the current document, as well as two default color groups: Print Color and Grayscale. These color groups can be selected and used any time.
The city was originally laid out in a grid pattern with the North Carolina State Capitol in Union Square at the center. During the American Civil War, the city was spared from any significant battle. It fell to the Union in the closing days of the war, and struggled with the economic hardships in the postwar period related to the reconstitution of labor markets, over-reliance on agriculture, and the social unrest of the Reconstruction Era.
Create and edit color groups of Raleigh city vector map, and also assign colors using the «Edit Colors»/ а «Repaint Graphic Object» dialog box.
A. Creating and editing of a color group on the «Edit» tab
B. Assigning colors on the «Assign» tab
C. Select a group of colors from the «Color groups» list
The option «Repaint a graphic object» in the lower part of the dialog box allows you to preview the colors on a selected layer of Vector map, or a group of elements, and specify whether its colors will be redefined when the dialog box is closed.
Following the establishment of the Research Triangle Park (RTP) in 1959, several tens of thousands of jobs were created in the fields of science and technology, and it became one of the fastest-growing communities in the United States by the early 21st century.
The main areas of the dialog box are:
«Edit»
The «Edit» tab is designed to create a new or edit the existing color groups.
The harmony rules Menu and the Color Wheel are used to conduct experiments with color harmonies. The color wheel shows how colors are related in color harmony, and the color bars allow you to view and manipulate an individual color values. In addition, you can adjust the brightness, add and remove colors, save color groups and view colors on the selected Vector Map of Raleigh city or a separated layers.
«Assign»
The «Assign» tab is used to view and control on how the original colors are replaced with colors from the color group like your corporate colors in the Vector Map of Raleigh city.
The assign color ability is provided only if the entire map, layer or fragment is selected in the document. You can specify which of new colors replace the current colors, whether the spot colors should be preserved and how colors are replaced (for example, you can replace colors completely or changing the color tone while maintaining the brightness). The «Assign» tab allows you to redefine colors in the Vector Map of Raleigh city, or in separate layers and fragments using the current color group or reducing the number of colors in the current Vector Map.
Geography
According to the United States Census Bureau, Raleigh occupies a total area of 144.0 square miles (373.0 km2), of which 142 square miles (369 km2) is land and 0.97 square miles (2.5 km2), or 0.76%, is covered by water. The Neuse River flows through the northeast end of the city.
Color groups
Is a list of all saved color groups for current document (the same groups appear in the «Samples» palette). You can edit and delete the existing color groups, as well as creating a new ones using the list of “Color Groups” in the dialog box. All changes appear in the «Samples» palette.
The highlighted color group shows, which color group is currently edited.
Any color group can be selected and edited, or used to redefine the colors in the selected vector map of Raleigh city, its fragments or elements.
Saving a color group adds this group to the specified list.
Opening the «Edit Colors»/«Repaint Graphic Object» dialog box.
Open the «Edit Colors»/«Repaint Graphic Object» dialog box using one of the following methods:
«Edit»> «Edit Colors»> «Repaint Graphic object» or «Repaint With Style».
Use these commands if you need to edit the colors in the selected vector map of Raleigh city.
«Repaint Graphic object» button on the «Control» panel.
Use this button if you need to adjust colors of Raleigh city vector map using the а «Repaint graphic object» dialog box.
The specified button is available if the selected vector map or its fragment contains two or more colors.
Note. This color editing method is convenient for global color adjustment in a vector map, if global colors were not used when creating a City Map of Raleigh.
Raleigh is located in the northeast central region of North Carolina, where the Piedmont and Atlantic Coastal Plain regions meet. This area is known as the “fall line” because it marks the elevation inland at which waterfalls begin to appear in creeks and rivers. As a result, most of Raleigh features gently rolling hills that slope eastward toward the state’s flat coastal plain. Its central Piedmont location situates Raleigh about two hours west of Atlantic Beach, North Carolina, by car and four hours east of the Great Smoky Mountains. The city is 155 miles (249 km) south of Richmond, Virginia, 263 miles (423 km) south of Washington, D.C., and 150 miles (240 km) northeast of Charlotte, North Carolina. A small portion of the city is located in Durham County.
The «Edit colors» button or «Edit or apply colors» on the «Color Catalog» palette
Click this button if you need to edit colors on the «Color Catalog» palette or edit and then apply them to the selected Vector Map of Raleigh city or its fragment.
The «Edit color group» button or «Edit or apply color group» on the «Samples» palette.
Click this button if you need to edit the colors in the specific color group or edit and apply them to the selected Vector Map of Raleigh city or a group of its elements, for example, the whole layer “Streets and lines”. You can also double-click the color group in the Samples panel to open the dialog box.
If the map file is too large and your computer freezes or even can’t open it quickly:
1. Try to reduce the color resolution of the video card (display) to 256 colors while working with a large map.
2. Using Windows Task Manager, select all the application you don’t need, while working with map, just turn them off.
3. Launch Adobe Illustrator. (DO NOT OPEN the vector map file)
4. Start the Windows Task Manager using administrator rights > Find the “Illustrator” process > set the «real time» priority,
5. Open the file. When you see the LEGACY FONT popup window – click “OK” (do not update). You can restore the TEXT later.
6. Can also be useful: When file is opened – Edit > Settings > Basic Settings > disable smoothing. /// It looks scary, but works quickly)))
We recommend saving the file in Adobe Illustrator 10 version. It’s much more stable when working with VERY BIG size files.
Chapel Hill is a town in Orange and Durham counties in the U.S. state of North Carolina. Its population was 57,233 in the 2010 census, making Chapel Hill the 15th-largest city in the state. Chapel Hill, Durham, and the state capital, Raleigh, make up the corners of the Research Triangle (officially the Raleigh–Durham–Chapel Hill combined statistical area), with a total population of 1,998,808.
The town was founded in 1793 and is centered on Franklin Street, covering 21.3 square miles (55 km2). It contains several districts and buildings listed on the National Register of Historic Places. The University of North Carolina at Chapel Hill and UNC Health Care are a major part of the economy and town influence. Local artists have created many murals.
Chapel Hill is located in the southeast corner of Orange County. It is bounded on the west by the town of Carrboro and on the northeast by the city of Durham. However, most of Chapel Hill’s borders are adjacent to unincorporated portions of Orange and Durham Counties rather than shared with another municipality. According to the United States Census Bureau, the town has a total area of 21.3 square miles (55.1 km2), of which 21.1 square miles (54.7 km2) is land and 0.15 square miles (0.4 km2) is covered by water.
Durham is a city in and the county seat of Durham County in the U.S. state of North Carolina. The U.S. Census Bureau estimated the city’s population to be 251,893 as of July 1, 2014, making it the 4th-most populous city in North Carolina, and the 78th-most populous city in the United States. Durham is the core of the four-county Durham-Chapel Hill Metropolitan Area, which has a population of 542,710 as of U.S. Census 2014 Population Estimates. The US Office of Management and Budget also includes Durham as a part of the Raleigh-Durham-Chapel Hill Combined Statistical Area, which has a population of 2,037,430 as of U.S. Census 2014 Population Estimates.
It is the home of Duke University and North Carolina Central University, and is also one of the vertices of the Research Triangle area (home of the Research Triangle Park).
Geography
Durham is located in the east-central part of the Piedmont region at 35°59′19″N 78°54′26″W (35.988644, −78.907167). Like much of the region, its topography is generally flat with some rolling hills.
The city has a total area of 108.3 square miles (280.4 km2), of which 107.4 square miles (278.1 km2) is land and 0.93 square miles (2.4 km2), or 0.84%, is water.
The soil is predominantly clay, making it poor for agriculture. The Eno River, a tributary of the Neuse River, passes through the northern part of Durham, along with several other small creeks. The center of Durham is on a ridge that forms the divide between the Neuse River watershed, flowing east to Pamlico Sound, and the Cape Fear River watershed, flowing south to the Atlantic near Wilmington. A small portion of the city is in Wake County
Small guide: How to work with the vector map?
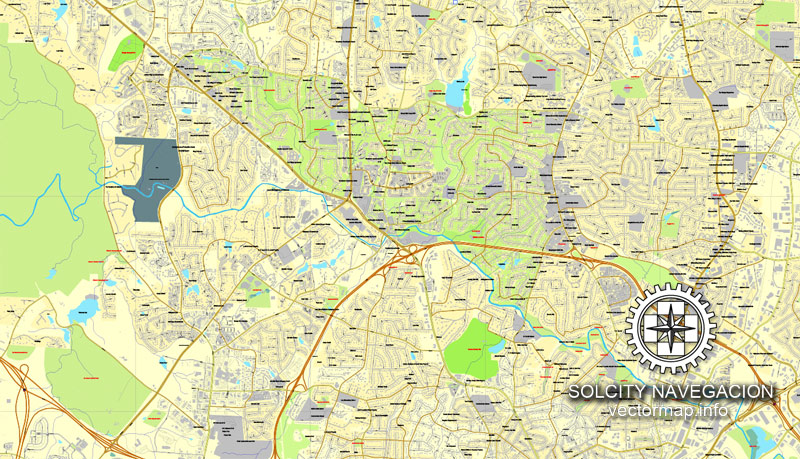
You can: Mass select objects by type and color – for example, the objects type “building” (they are usually dark gray) – and remove them from the map, if you do not need them in your print or design project. You can also easily change the thickness of lines (streets), just bulk selection the road by the line color.
The streets are separated by type, for example, type “residential road” are usually white with a gray stroke. Highway usually orange with a brown or dark gray stroke.
It is easy to change the font of inscriptions, all or each individually. Also, just can be make and any other manipulation of objects on the vector map in Adobe illustrator format.
Important: All the proportions on the map are true, that is, the relative sizes of the objects are true, because Map is based on an accurate GPS projection, and It transated into the (usual for all) the Mercator projection.
You can easily change the color, stroke and fill of any object on the map, zoom without loss of quality Image Verification.
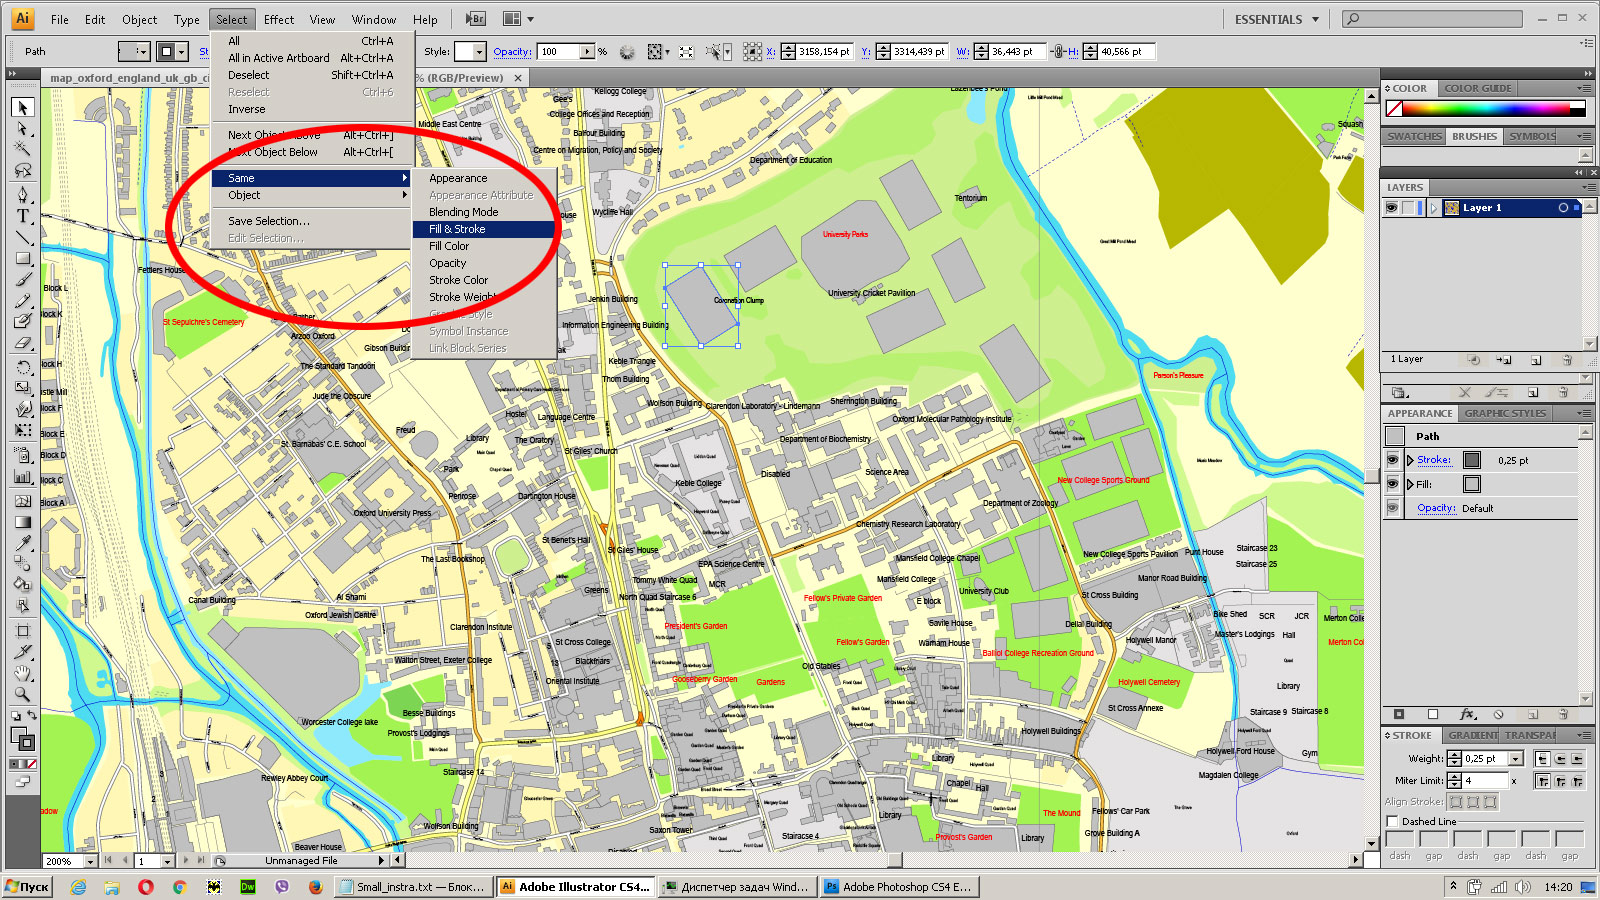
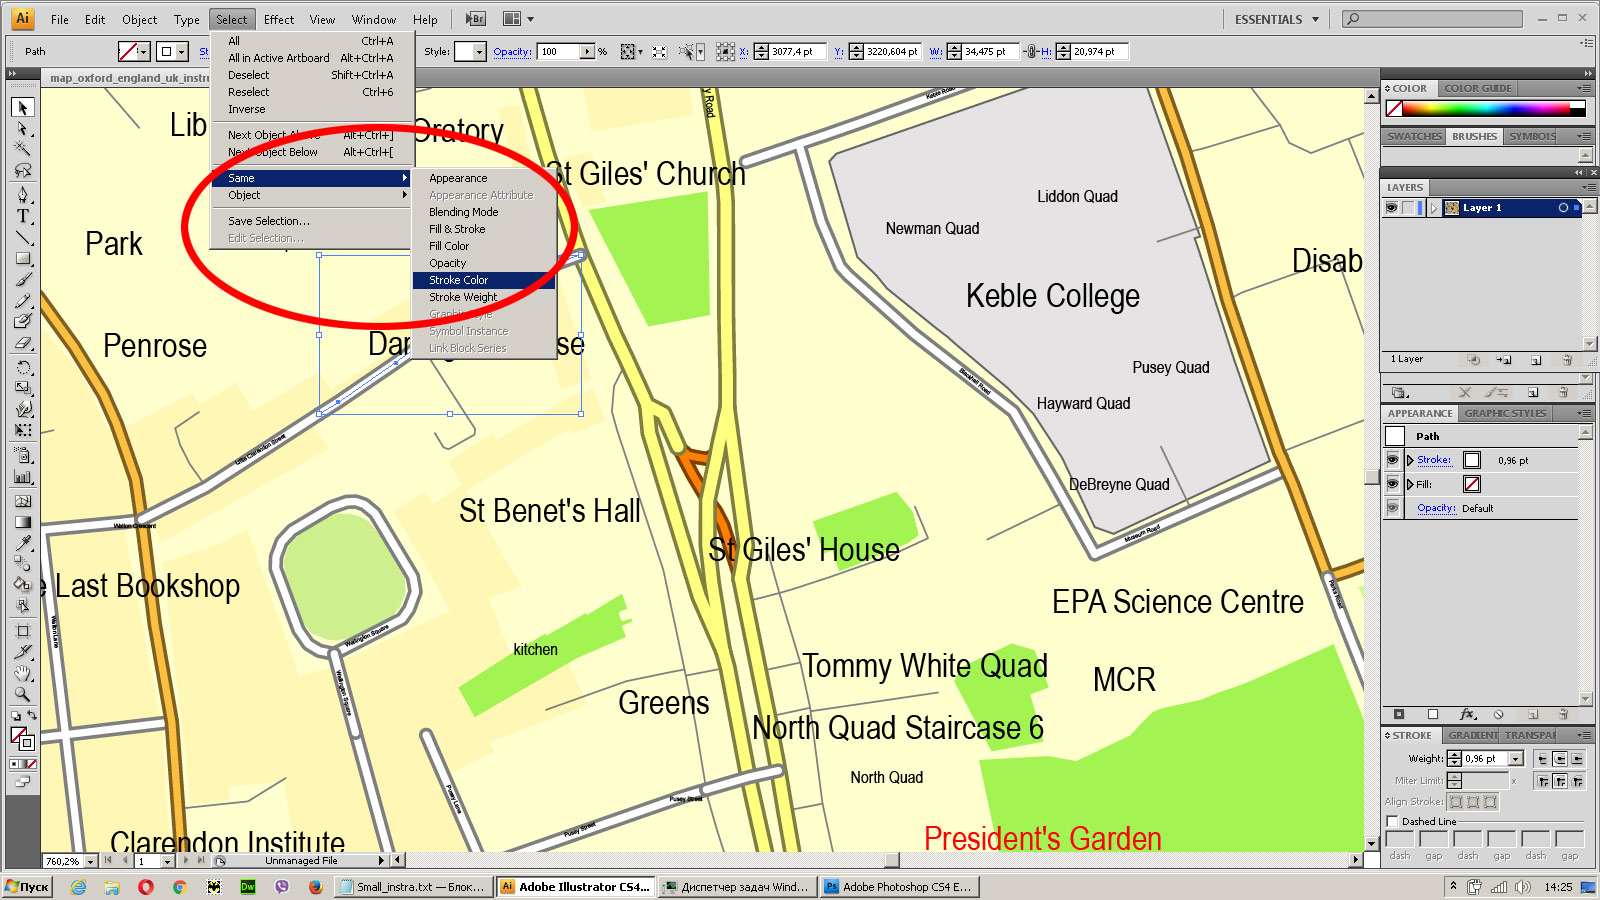
Select object
Bulk selection the same objects on the vector map
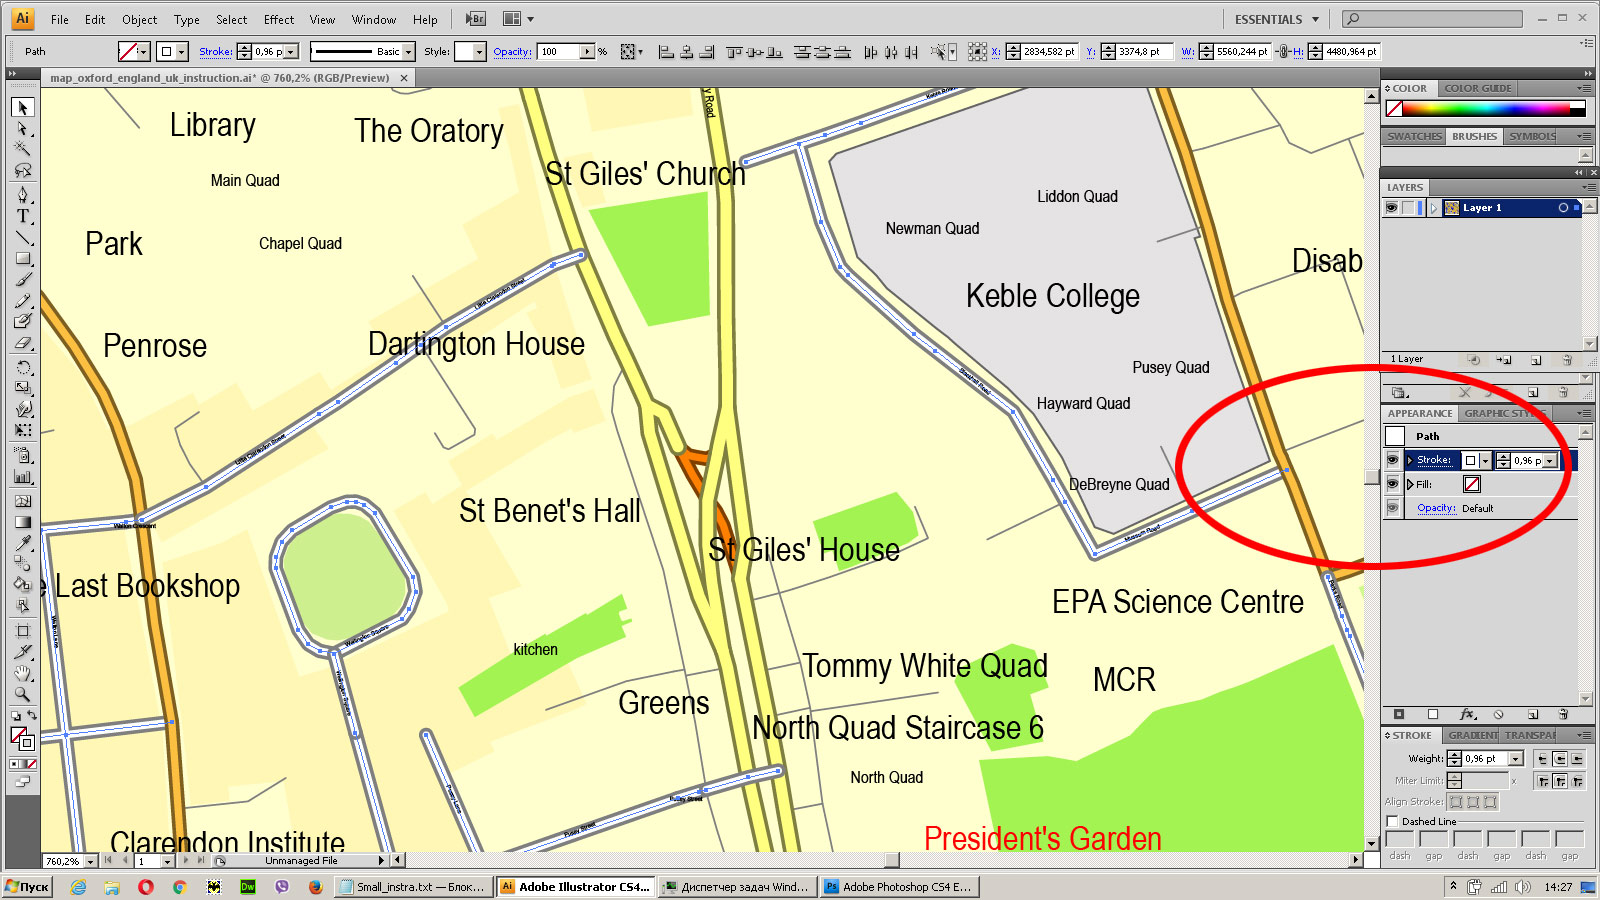
See the bulk selected objects on the vector map
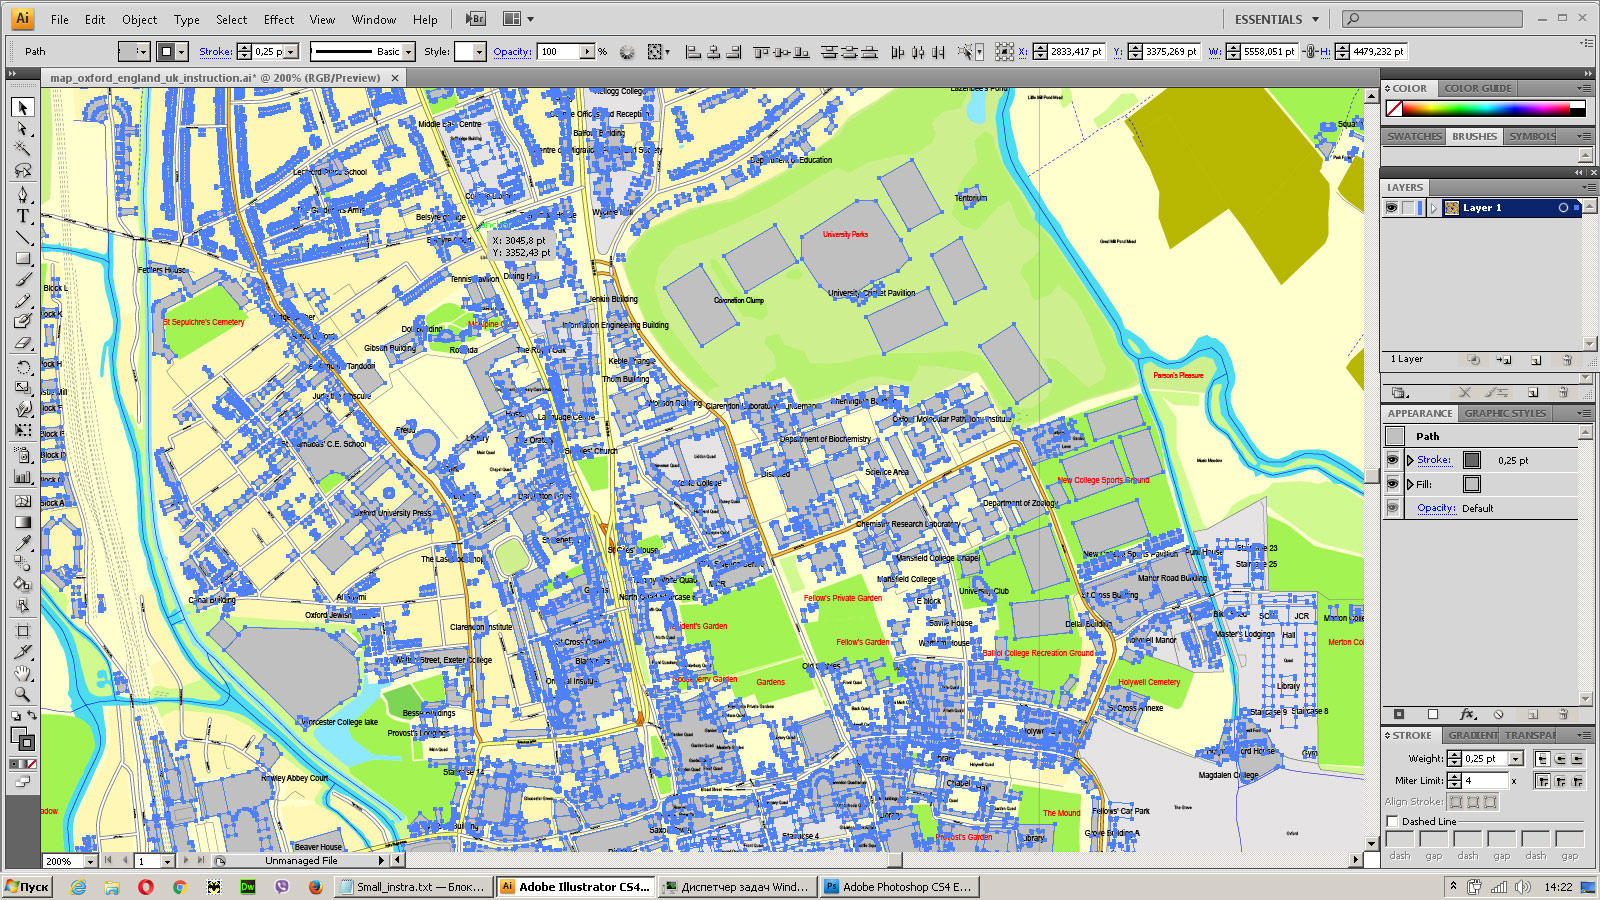
Bulk delete buildungs from the vector map
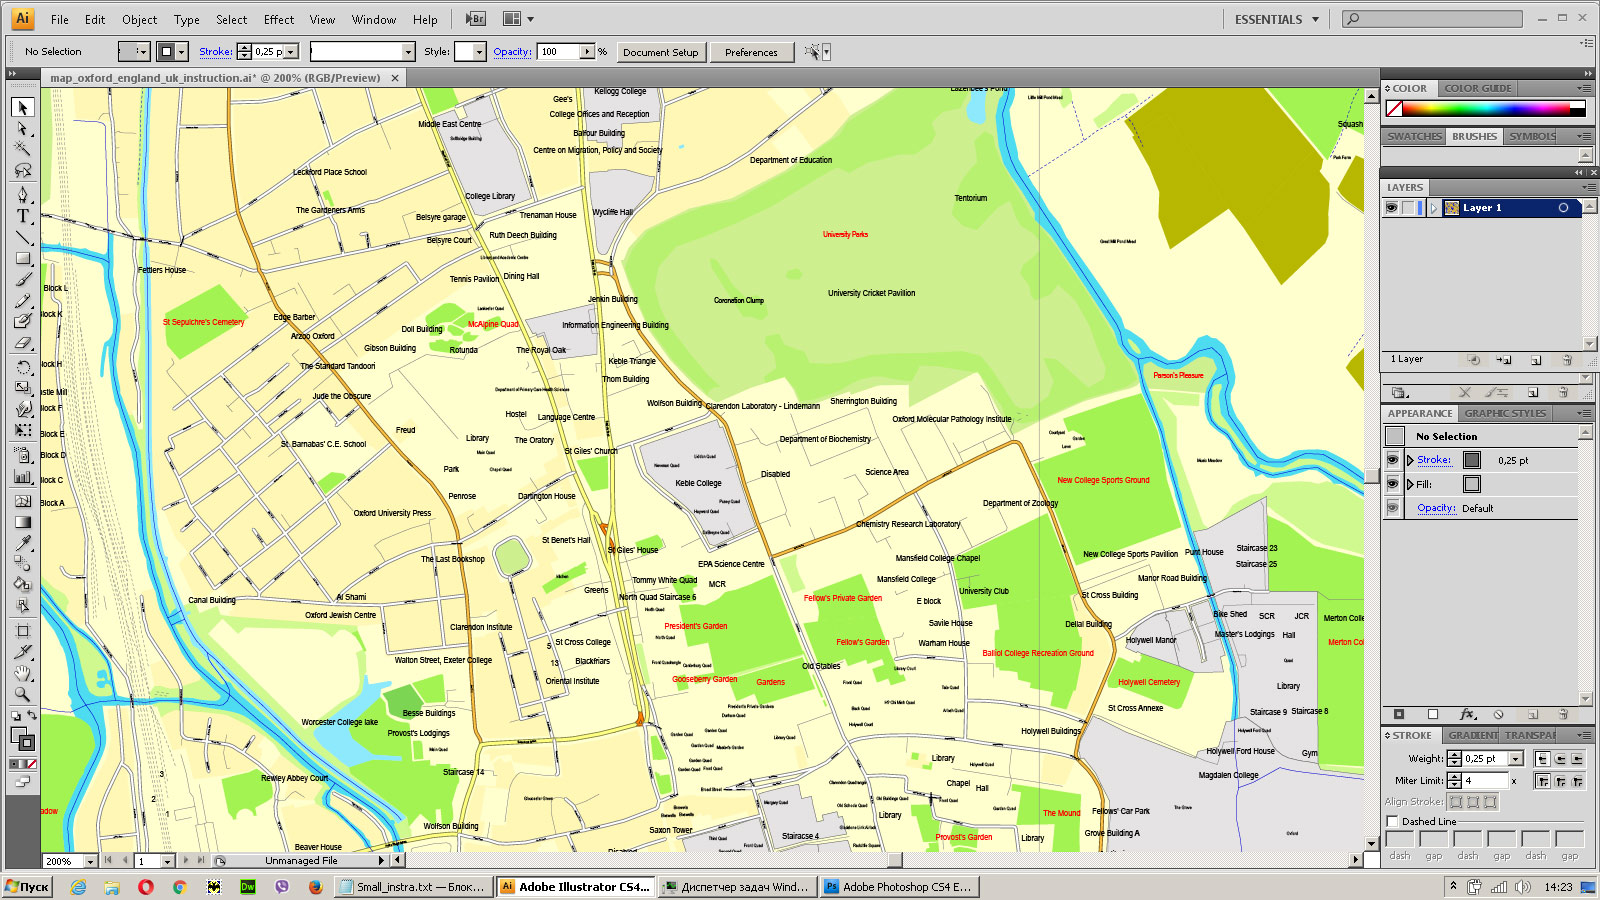
Select residencial road (small street) on the vector map
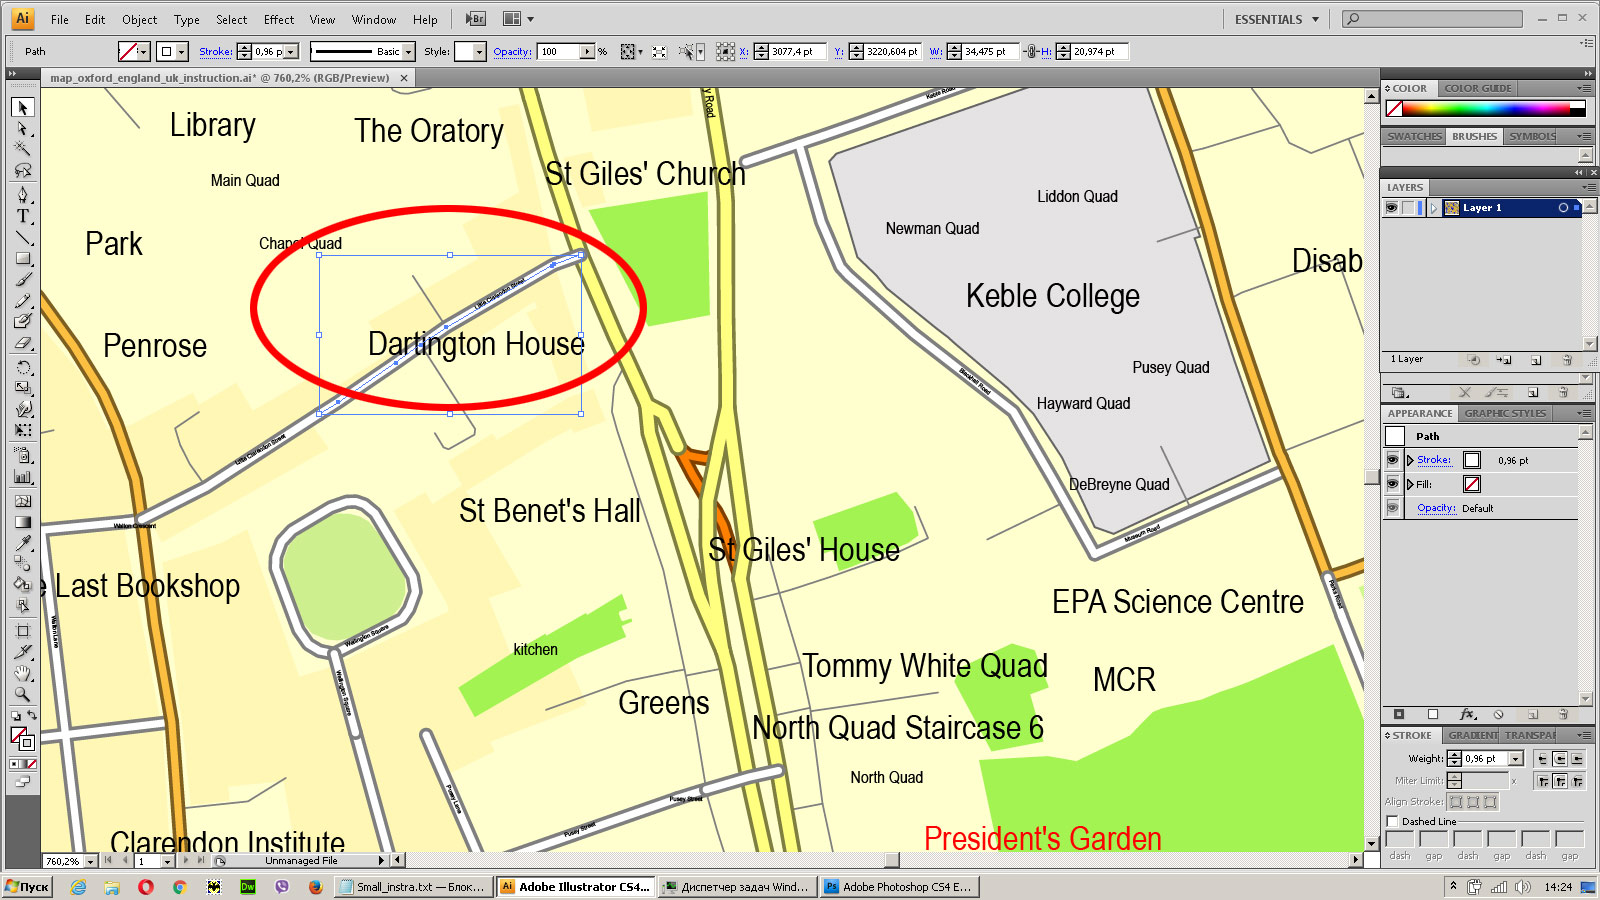
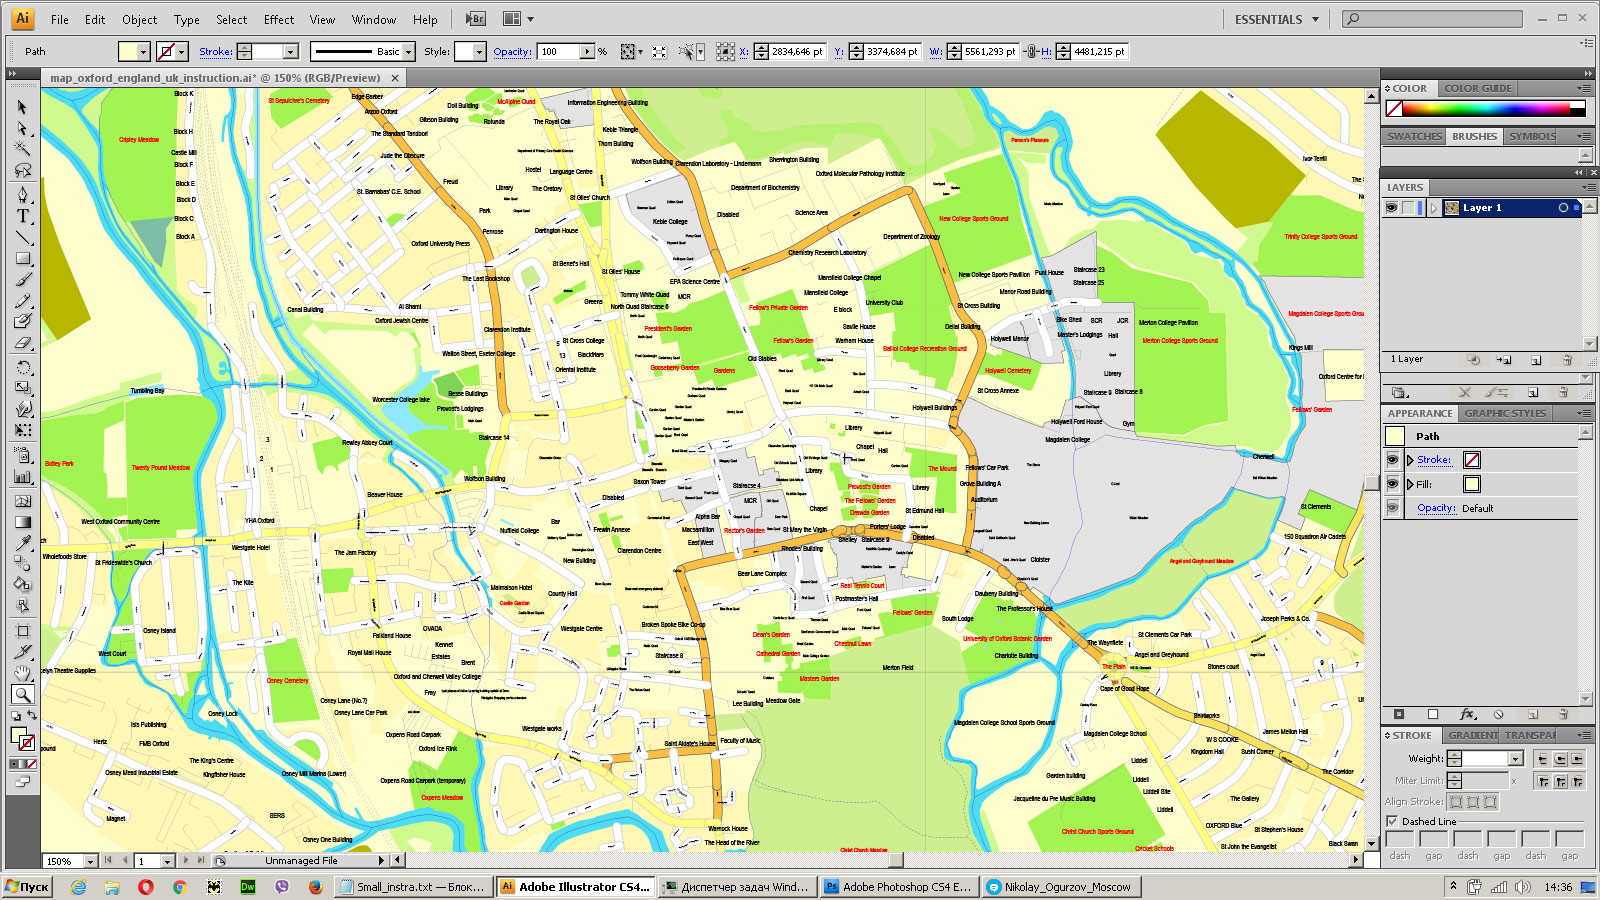
Bulk selection the same lines (streets, roads) on the full map
Create fat lines of the streets on the vector maps (bulk action) 1
Create fat lines of the streets on the vector maps (bulk action) 2

Create fat lines of the streets on the vector maps (bulk action) 3
You can easily change the color, stroke and fill of any object on the map, zoom without loss of quality Image Verification.

 Author: Kirill Shrayber, Ph.D. FRGS

