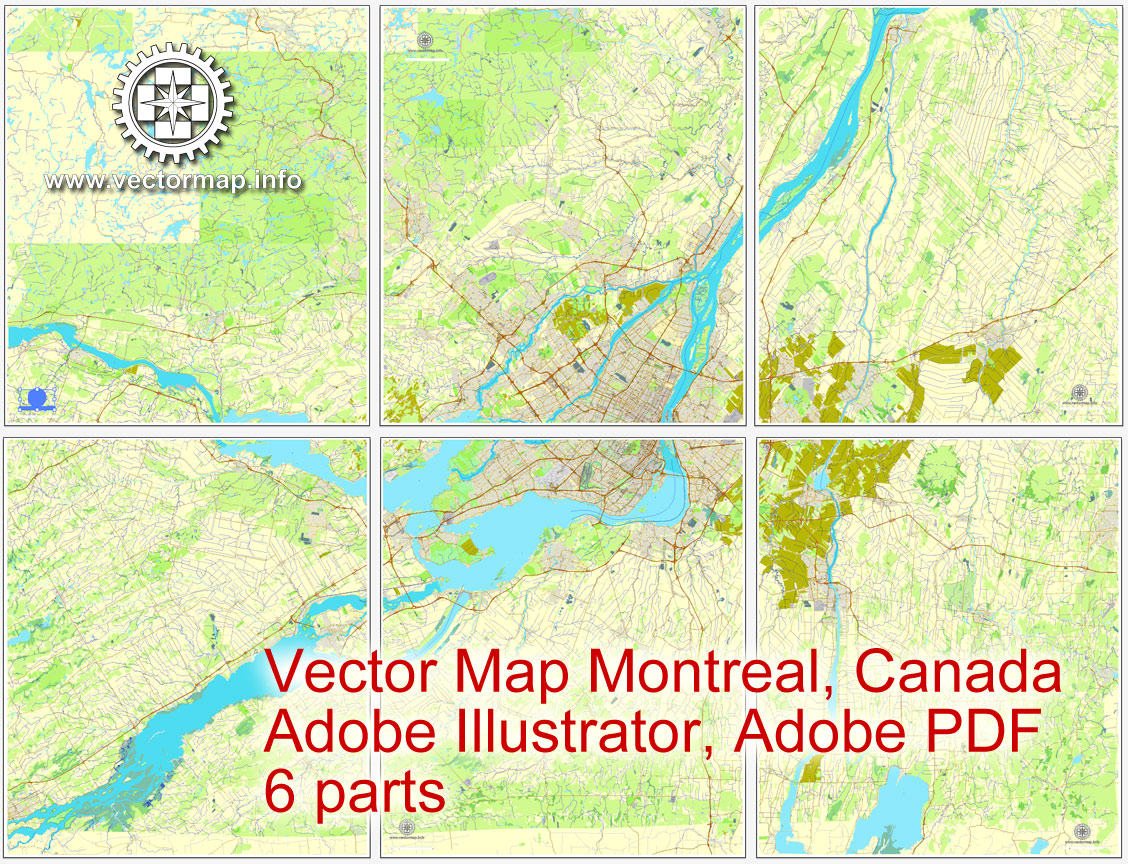
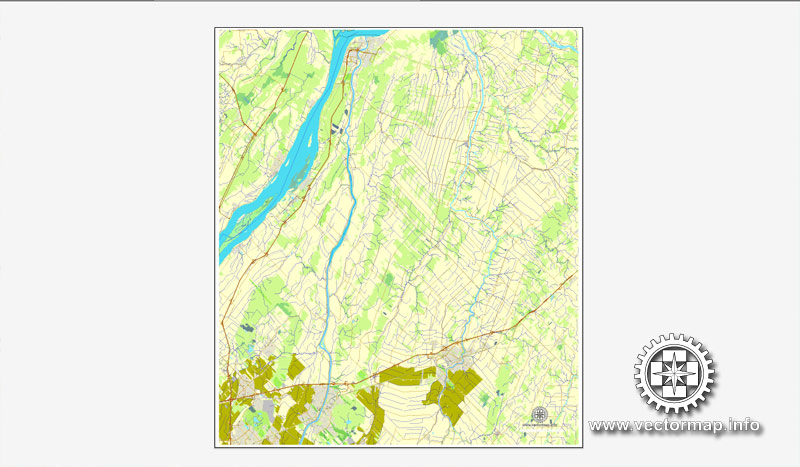
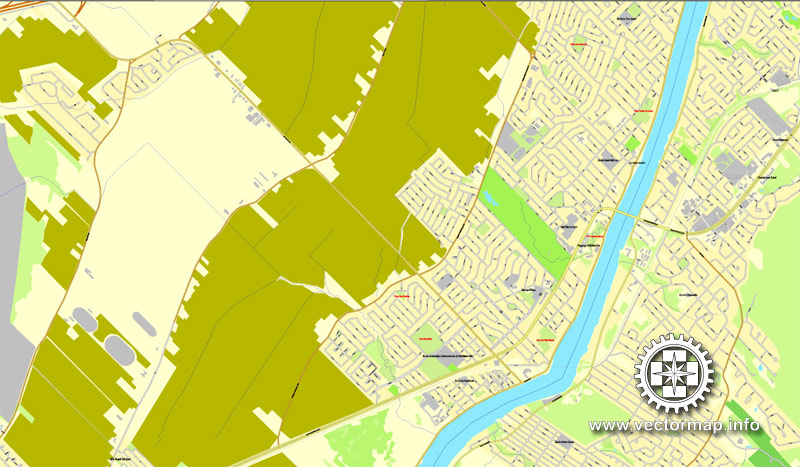
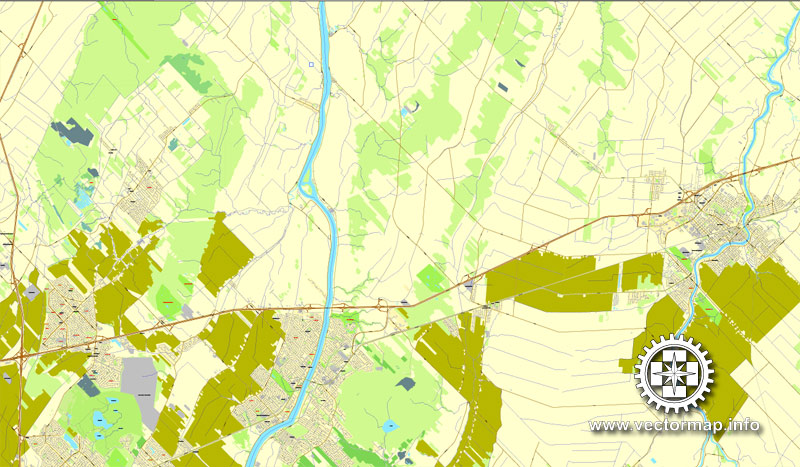
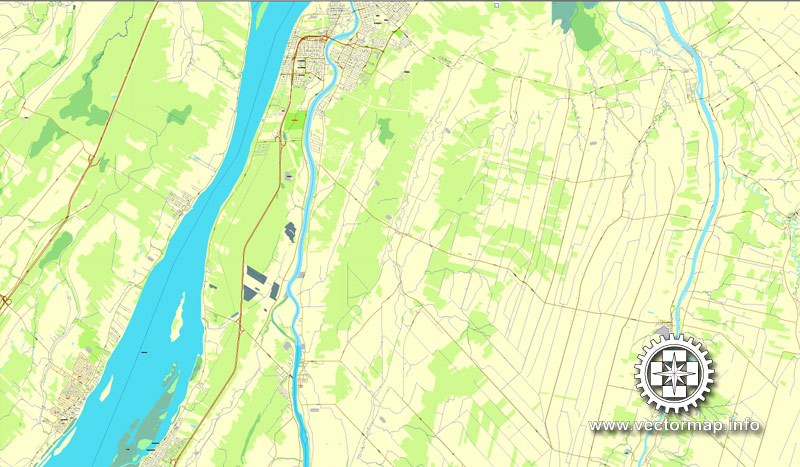
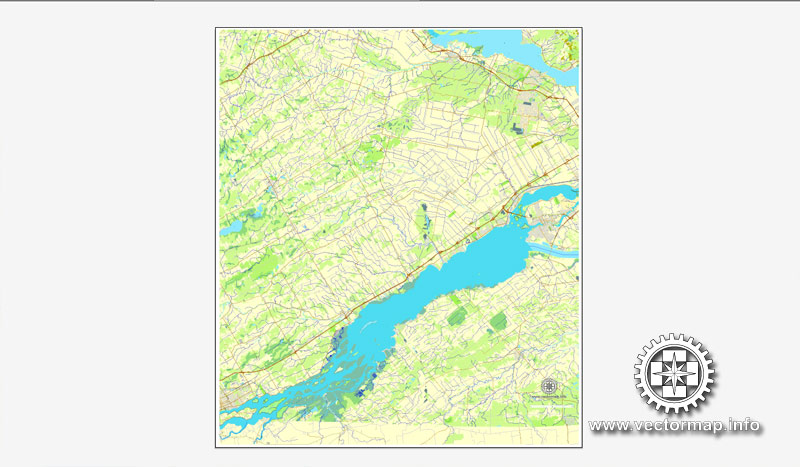
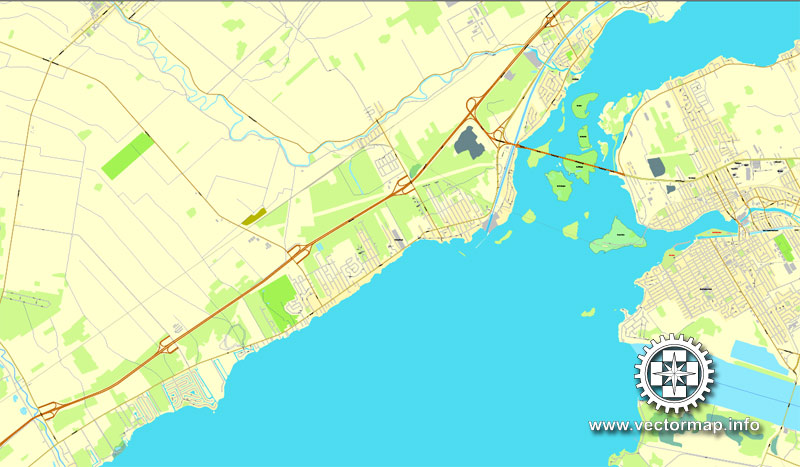
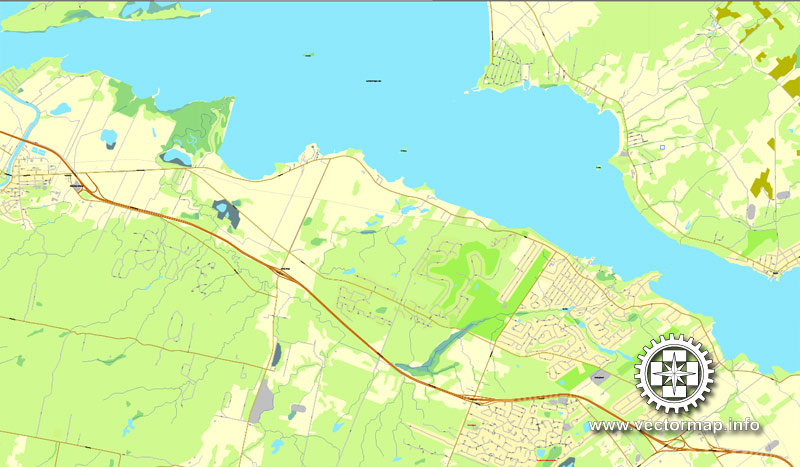
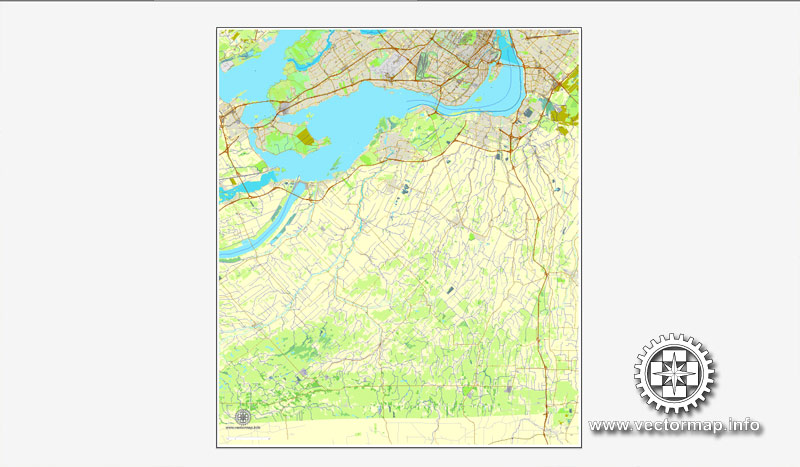
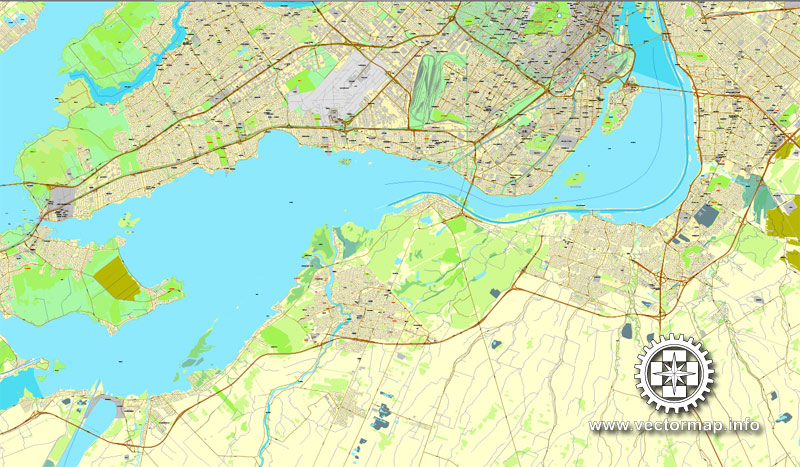
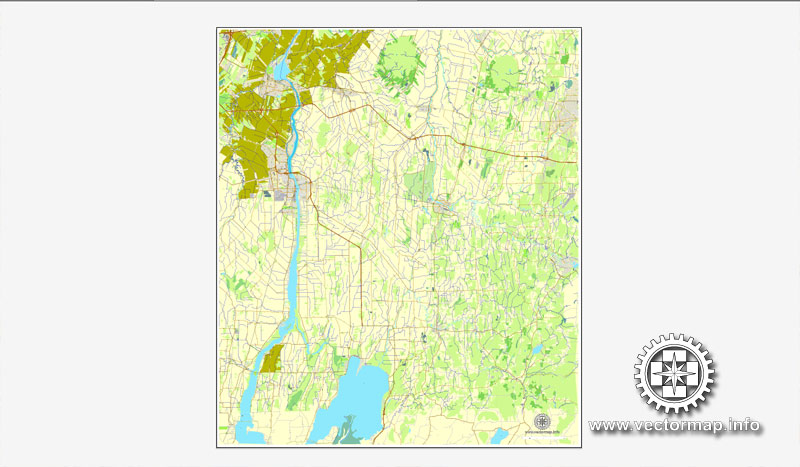
Montreal and surroundings, Canada, printable vector street City Plan map, fully editable, Adobe PDF 6 parts map, full vector, scalable, editable text format street names, 110 mb ZIP
All streets, some MORE buildings. Map for design, print, arts, projects, presentations.
You can edit this file by Adobe Illustrator, Adobe Acrobat, Corel Draw.
DWG, DXF, CDR and other formats – on request, same price, please, contact
Montreal, Canada
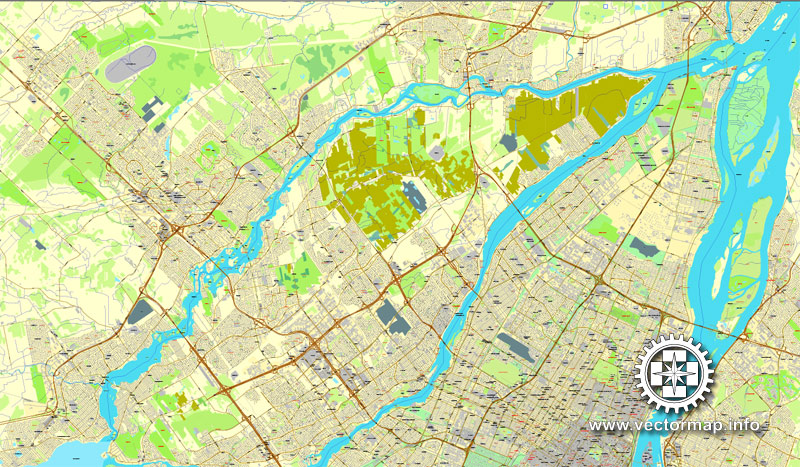
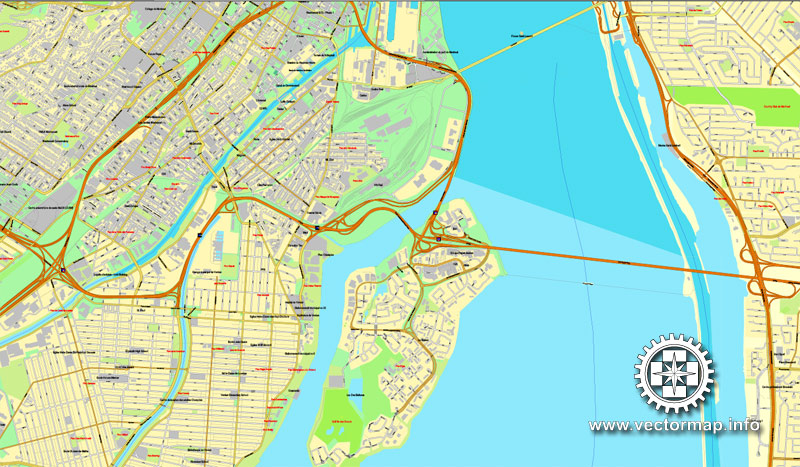
This vector map of Montreal city is used as a basis for design, editing, and further printing.
This is the most detailed, exact map of Montreal city for high-quality printing and polygraphy. You can always clarify the map development date by contacting us.
For your convenience, all objects on Montreal vector city map are divided into layers. And the editing is very easy – colors, lines, etc.
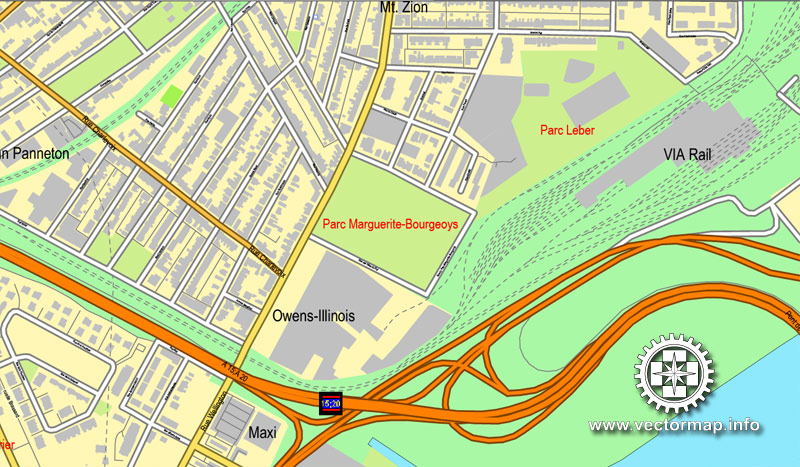
You can easily add any objects needed (e.g. shops, salons, sale points, gas station or attraction) on any layer of Montreal vector map.
One of the advantages of Montreal city vector maps of our production is the relevance of cartographic data, we constantly update all our products.
Montreal
Municipality in Québec, Canada
Montréal is the largest city in Canada’s Québec province. It’s set on an island in the Saint Lawrence River and named after Mt. Royal, the triple-peaked hill at its heart. Its boroughs, many of which were once independent cities, include neighbourhoods ranging from cobblestoned, French colonial Vieux-Montréal – with the Gothic Revival Notre-Dame Basilica at its centre – to bohemian Plateau.
This vector map of Montreal city is used by:
designers, layout designers, printers, advertisers and architects. Our product – vector maps – is designed for further editing and printing in large formats – from @Wall format (a few meters) to A-0 and A-1, A-2, A-3.
The Montreal city map in vector format is used for design, urban planning, presentations and media visualizations.
The advertising and presentation map of Montreal city (usually the final designer marks the routes, and puts the client’s objects (shops, saloons, gas stations etc.)
The undoubted advantage is that people will NEVER throw out this advertising product – the map. In fact, as an advertising medium, a city map is the most “long-playing” of the well-known polygraphic advertising media, with the longest lifespan, and the maximum number of interactions with the customer.
The city is centred on the Island of Montreal, which took its name from the same source as the city, and a few much smaller peripheral islands, the largest of which is Île Bizard. It has a distinct four-season continental climate with warm to hot summers and cold, snowy winters.
In 2016, the city had a population of 1,704,694. Montreal’s metropolitan area had a population of 4,098,927 and a population of 1,942,044 in the urban agglomeration, with all of the municipalities on the Island of Montreal included.
For travelers, maps are sold at the airports and gas stations around the world. Often the source is our vector maps.
Take a look, who purchases our vector maps of Montreal city in “Our Clients and Friends” page – these are large and small companies, from super-brands like Volvo and Starbucks, to small design studios and printing houses.
It’s very easy to work with vector maps of Montreal city, even for a not very experienced designer who can turn on and off the map layers, add new objects, change the colors of fill and lines according to customer requirements.
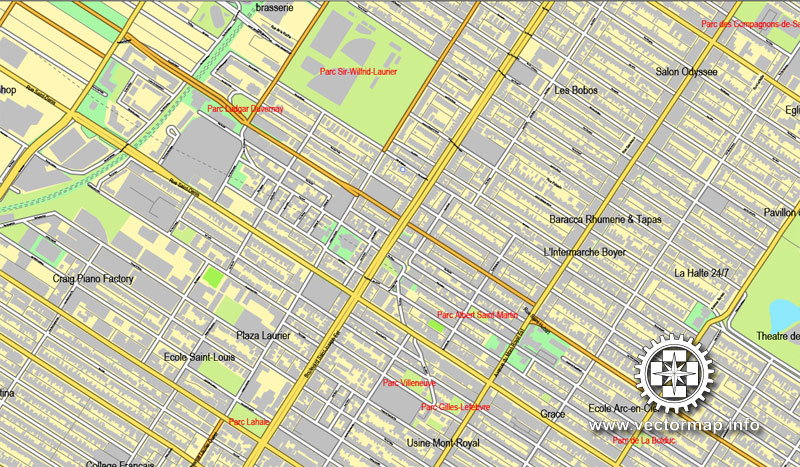
The undoubted advantage of Montreal city vector maps in printing is an excellent and detailed visualization, when customer can expand a large paper map and instantly define his location, find a landmark, an object or address on map, unlike using the popular electronic formats of Google and Yandex maps for example.
Printable vector maps of Montreal city are much more convenient and efficient than any electronic maps on your smartphone, because ALL DETAILS are displayed in the entire space of Montreal city map.
French is the city’s official language and is the language spoken at home by 49.8% of the population of the city, followed by English at 22.8% and 18.3% other languages (in the 2016 census, not including multi-language responses). In the larger Montreal Census Metropolitan Area, 65.8% of the population speaks French at home, compared to 15.3% who speak English. The agglomeration Montreal is one of the most bilingual cities in Quebec and Canada, with over 59% of the population able to speak both English and French. Montreal is the second-largest primarily French-speaking city in the world, after Paris. It is situated 258 kilometres (160 mi) south-west of Quebec City.
Useful tips on working with vector maps of cities and countries in Adobe Illustrator.
«V» – launches the Selection tool (cursor, black arrow), which makes active any vector line.
«А» – launches the Direct Selection tool (white cursor), allows you to select curve elements and drag them to the desired place.
«R» – activates the Rotate tool, which helps you rotating selected objects around the center point by 360 degrees.
«E» – gives you the opportunity to use the Eraser tool and erase unnecessary parts.
«X» – switches between Fill and Stroke in the Tools section. Try to get used to this hot key and
you will quickly understand that you can’t live and work without it.
Guides are not limited to vertical and horizontal in Adobe Illustrator. You can also create a diagonal guide for example. Moreover, you can turn any contours into guides. Select the outline and go to View > Guides > Make Guides (Create Guides), or simply press Cmd/Ctrl + 5. You can also turn the guides back into an editable object. Go to menu, View > Guides > Unlock Guides (Release Guides), select the guide you want to edit and select View > Guides > Release Guides (Reset Guides), or just press Cmd/Ctrl + Option / Alt + 5).
You will probably want to change the color scheme used on our Montreal vector city map.
To quickly and effectively play with colors.
Of course, you can do it manually, all objects in our Montreal city vector map are divided according to types and layers, and you can easily change the color gamma of vector objects in groups and layers.
Historically the commercial capital of Canada, Montreal was surpassed in population and in economic strength by Toronto in the 1970s. It remains an important centre of commerce, aerospace, transport, finance, pharmaceuticals, technology, design, education, art, culture, tourism, food, fashion, gaming, film, and world affairs.
But there is more effective way of working with the whole VECTOR MAP of Montreal city and all layers:
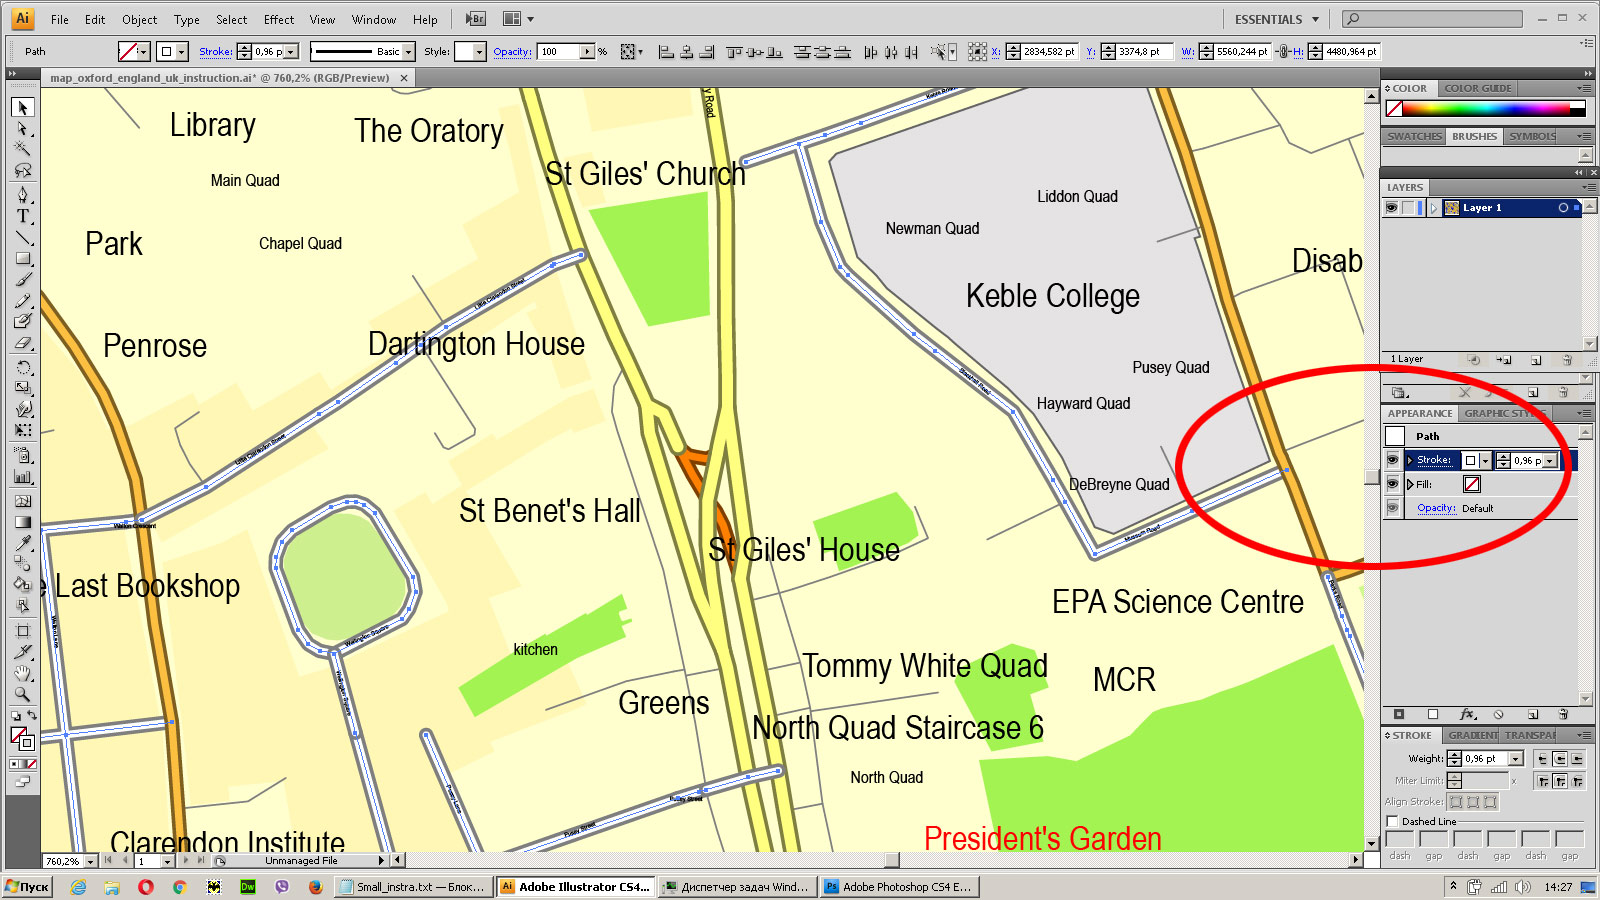
The overview dialog «Edit colors»/«Repaint Graphic Object» (this dialog box name can change depending on the context):
If you have selected a part or a layer of Montreal city vector map and open the dialog box by clicking the icon in the Control panel, on the Samples palette or the Color Catalog, or if you choose Edit > Edit Colors> Repaint Graphic Object, then the «Repaint Graphic Object» dialog box appears, and you get access to «Assign» and «Edit» tabs.
If a picture or a map fragment is not selected, and you open the dialog box by clicking the icon in the Control panel, on the Samples palette or in the Color Catalog, the «Edit Colors» dialog box appears and you can only access the «Edit» tab.
Montreal has the second-highest number of consulates in North America, serves as the location of the headquarters of the International Civil Aviation Organization, and was named a UNESCO City of Design in 2006. In 2017, Montreal was ranked the 12th most liveable city in the world by the Economist Intelligence Unit in its annual Global Liveability Ranking,Geographic location
Montreal is located in the southwest of the province of Quebec, approximately 275 km (171 mi) southwest of Quebec City, the provincial capital, and 167 km (104 mi) east of Ottawa, the federal capital. It also lies 502 km (312 mi) northeast of Toronto, 407 kilometres (253 mi) northwest of Boston and 530 km (330 mi) directly north of New York City.
Regardless of the name at the top of the dialog box, the right-hand side always displays the color group of the current document, as well as two default color groups: Print Color and Grayscale. These color groups can be selected and used any time.
Create and edit color groups of Montreal city vector map, and also assign colors using the «Edit Colors»/ а «Repaint Graphic Object» dialog box.
The city is located on the central and eastern portions of the Island of Montreal, the largest island in the Hochelaga Archipelago, at the confluence of the Saint Lawrence and Ottawa Rivers. The port of Montreal lies at one end of the Saint Lawrence Seaway, which is the river gateway that stretches from the Great Lakes into the Atlantic Ocean. Montreal is defined by its location in between the St. Lawrence river on its south, and by the Rivière des Prairies on its north. The city is named after the most prominent geographical feature on the island, a three-head hill called Mount Royal.
A. Creating and editing of a color group on the «Edit» tab
B. Assigning colors on the «Assign» tab
C. Select a group of colors from the «Color groups» list
The option «Repaint a graphic object» in the lower part of the dialog box allows you to preview the colors on a selected layer of Vector map, or a group of elements, and specify whether its colors will be redefined when the dialog box is closed.
Montreal is at the centre of the Montreal Metropolitan Community, and is bordered by the city of Laval to the north, Longueuil to the south, Repentigny to the east and the West Island municipalities to the west. The anglophone enclaves of Westmount, Montreal West, Hampstead, Côte Saint-Luc, the Town of Mount Royal and the francophone enclave Montreal East are all entirely surrounded by the city of Montreal.
The main areas of the dialog box are:
«Edit»
The «Edit» tab is designed to create a new or edit the existing color groups.
The harmony rules Menu and the Color Wheel are used to conduct experiments with color harmonies. The color wheel shows how colors are related in color harmony, and the color bars allow you to view and manipulate an individual color values. In addition, you can adjust the brightness, add and remove colors, save color groups and view colors on the selected Vector Map of Montreal city or a separated layers.
«Assign»
The «Assign» tab is used to view and control on how the original colors are replaced with colors from the color group like your corporate colors in the Vector Map of Montreal city.
The assign color ability is provided only if the entire map, layer or fragment is selected in the document. You can specify which of new colors replace the current colors, whether the spot colors should be preserved and how colors are replaced (for example, you can replace colors completely or changing the color tone while maintaining the brightness). The «Assign» tab allows you to redefine colors in the Vector Map of Montreal city, or in separate layers and fragments using the current color group or reducing the number of colors in the current Vector Map.
Geology
There are ten main geological regions in Quebec: the great igneous plains of the Canadian Shield, the Appalachians in southern Quebec, and the St. Lawrence lowlands that lie between them. Covering over 95% of Quebec, the Canadian Shield contains some of the oldest igneous rocks in the world, dating back to the Precambrian period, over 1 billion years ago.
Color groups
Is a list of all saved color groups for current document (the same groups appear in the «Samples» palette). You can edit and delete the existing color groups, as well as creating a new ones using the list of “Color Groups” in the dialog box. All changes appear in the «Samples» palette.
The highlighted color group shows, which color group is currently edited.
Any color group can be selected and edited, or used to redefine the colors in the selected vector map of Montreal city, its fragments or elements.
The Canadian Shield is generally quite flat and exposed, punctuated by the higher relief of mountain ranges such as the Laurentians in southern Quebec. The Appalachian region of Quebec is a thin strip of weathered mountains along Quebec’s southeast border. The Appalachian mountain chain is actually a long range that runs from Alabama north to Newfoundland. The St. Lawrence lowlands are comparatively tiny in size (about 17,280 km2 (6,670 sq mi)) but disproportionately important in that they contain most of the human population of Quebec. The lowlands actually consist of three parts: the central lowlands, or the St. Lawrence Plain, a wide and flat triangle extending from Cornwall to Quebec City. The St. Lawrence Plain is almost entirely flat because of the clay deposits left behind by the Champlain Sea (which once covered all of Montreal).
Saving a color group adds this group to the specified list.
Opening the «Edit Colors»/«Repaint Graphic Object» dialog box.
Open the «Edit Colors»/«Repaint Graphic Object» dialog box using one of the following methods:
«Edit»> «Edit Colors»> «Repaint Graphic object» or «Repaint With Style».
Use these commands if you need to edit the colors in the selected vector map of Montreal city.
«Repaint Graphic object» button on the «Control» panel.
Use this button if you need to adjust colors of Montreal city vector map using the а «Repaint graphic object» dialog box.
The specified button is available if the selected vector map or its fragment contains two or more colors.
Note. This color editing method is convenient for global color adjustment in a vector map, if global colors were not used when creating a City Map of Montreal.
The «Edit colors» button or «Edit or apply colors» on the «Color Catalog» palette
Click this button if you need to edit colors on the «Color Catalog» palette or edit and then apply them to the selected Vector Map of Montreal city or its fragment.
printable_map_montreal_ca_g_view_level_17_ai_10_ai_17
The «Edit color group» button or «Edit or apply color group» on the «Samples» palette.
Click this button if you need to edit the colors in the specific color group or edit and apply them to the selected Vector Map of Montreal city or a group of its elements, for example, the whole layer “Streets and lines”. You can also double-click the color group in the Samples panel to open the dialog box.
Street directions
One quirk of common Montreal parlance is that directions (north, south, east, and west) along the street grid are sharply skewed relative to the actual compass directions. The St. Lawrence River is taken as flowing west to east (even though it flows north or northeast past the island), so that directions along streets parallel to the river are referred to as “west” and “east,” and those along streets perpendicular to the river, “north” and “south.” In much of Montreal, “north” is actually northwest, and in some areas such as Verdun and Pointe-aux-Trembles it is actually due west. “Montreal directions” are used in naming street addresses and describing bus routes, among other things. As a result of this discrepancy, Montreal has been called “the only city where the sun sets in the north.”
If the map file is too large and your computer freezes or even can’t open it quickly:
1. Try to reduce the color resolution of the video card (display) to 256 colors while working with a large map.
2. Using Windows Task Manager, select all the application you don’t need, while working with map, just turn them off.
3. Launch Adobe Illustrator. (DO NOT OPEN the vector map file)
4. Start the Windows Task Manager using administrator rights > Find the “Illustrator” process > set the «real time» priority,
5. Open the file. When you see the LEGACY FONT popup window – click “OK” (do not update). You can restore the TEXT later.
6. Can also be useful: When file is opened – Edit > Settings > Basic Settings > disable smoothing. /// It looks scary, but works quickly)))
We recommend saving the file in Adobe Illustrator 10 version. It’s much more stable when working with VERY BIG size files.
Further folk naming customs include giving directions involving going “up” or “down” streets that are perpendicular to the river; “up” being towards Mount Royal and “down” being towards the St. Lawrence. But the system can be confused on the north side of the mountain (whether “up” means uphill, i.e. Montreal “south,” or towards Montreal “north” as it does downtown).
Streets are named “Ouest” or “Est” when they cross Saint Laurent Boulevard. Street numbers rise eastward and westward from Saint Laurent Boulevard, and northward from the St. Lawrence River and the Lachine Canal. (A few streets in Le Sud-Ouest borough, such as rue Charlevoix, cross the Lachine Canal. In those cases, the addresses south of the Lachine Canal have an “O” prefixed to their street numbers.) and the best city in the world to be a university student in the QS World University Rankings. Montreal has hosted multiple international conferences and events, including the 1967 International and Universal Exposition and the 1976 Summer Olympics. It is the only Canadian city to have held the Summer Olympics. In 2018, Montreal was ranked as a Alpha- world city. As of 2016 the city hosts the Canadian Grand Prix of Formula One, the Montreal International Jazz Festival and the Just for Laughs festival.
Geography of Montreal
Montreal is a city located in the province of Quebec in Canada. The Geography of Montreal is very diverse. Montreal contains two rivers, and 10 geographical regions. There are four distinct seasons in Montreal, each with different temperatures and weather. The levels of sunshine and precipitation vary with each season annually. The citizens of Montreal also have a unique way of determining directions.
Geographic location
Montreal is located in the southwest of the province of Quebec, approximately 275 km (171 mi) southwest of Quebec City, the provincial capital, and 167 km (104 mi) east of Ottawa, the federal capital. It also lies 502 km (312 mi) northeast of Toronto, 407 kilometres (253 mi) northwest of Boston and 530 km (330 mi) directly north of New York City.
The city is located on the central and eastern portions of the Island of Montreal, the largest island in the Hochelaga Archipelago, at the confluence of the Saint Lawrence and Ottawa Rivers. The port of Montreal lies at one end of the Saint Lawrence Seaway, which is the river gateway that stretches from the Great Lakes into the Atlantic Ocean. Montreal is defined by its location in between the St. Lawrence river on its south, and by the Rivière des Prairies on its north. The city is named after the most prominent geographical feature on the island, a three-head hill called Mount Royal.
Montreal is at the centre of the Montreal Metropolitan Community, and is bordered by the city of Laval to the north, Longueuil to the south, Repentigny to the east and the West Island municipalities to the west. The anglophone enclaves of Westmount, Montreal West, Hampstead, Côte Saint-Luc, the Town of Mount Royal and the francophone enclave Montreal East are all entirely surrounded by the city of Montreal.
Geology
There are ten main geological regions in Quebec: the great igneous plains of the Canadian Shield, the Appalachians in southern Quebec, and the St. Lawrence lowlands that lie between them. Covering over 95% of Quebec, the Canadian Shield contains some of the oldest igneous rocks in the world, dating back to the Precambrian period, over 1 billion years ago. The Canadian Shield is generally quite flat and exposed, punctuated by the higher relief of mountain ranges such as the Laurentians in southern Quebec.
The Appalachian region of Quebec is a thin strip of weathered mountains along Quebec’s southeast border. The Appalachian mountain chain is actually a long range that runs from Alabama north to Newfoundland. The St. Lawrence lowlands are comparatively tiny in size (about 17,280 km2 (6,670 sq mi)) but disproportionately important in that they contain most of the human population of Quebec. The lowlands actually consist of three parts: the central lowlands, or the St. Lawrence Plain, a wide and flat triangle extending from Cornwall to Quebec City. The St. Lawrence Plain is almost entirely flat because of the clay deposits left behind by the Champlain Sea (which once covered all of Montreal).
Small guide: How to work with the vector map?
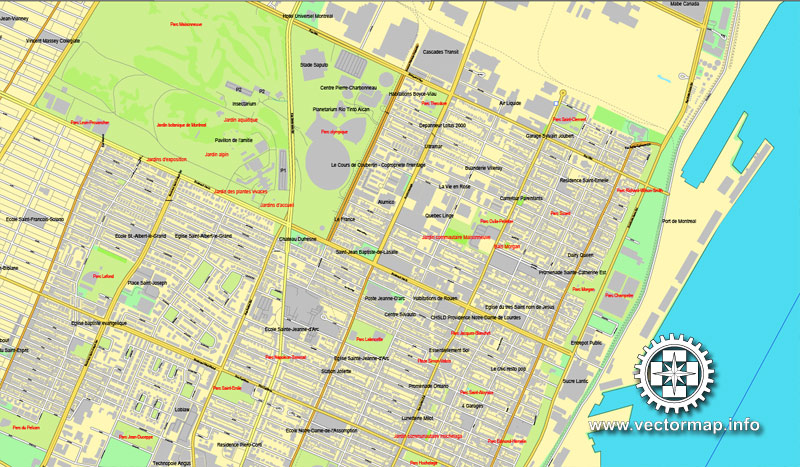
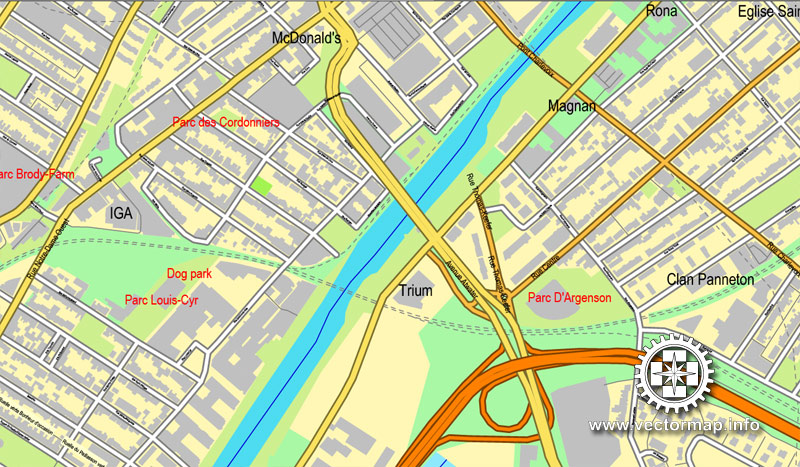
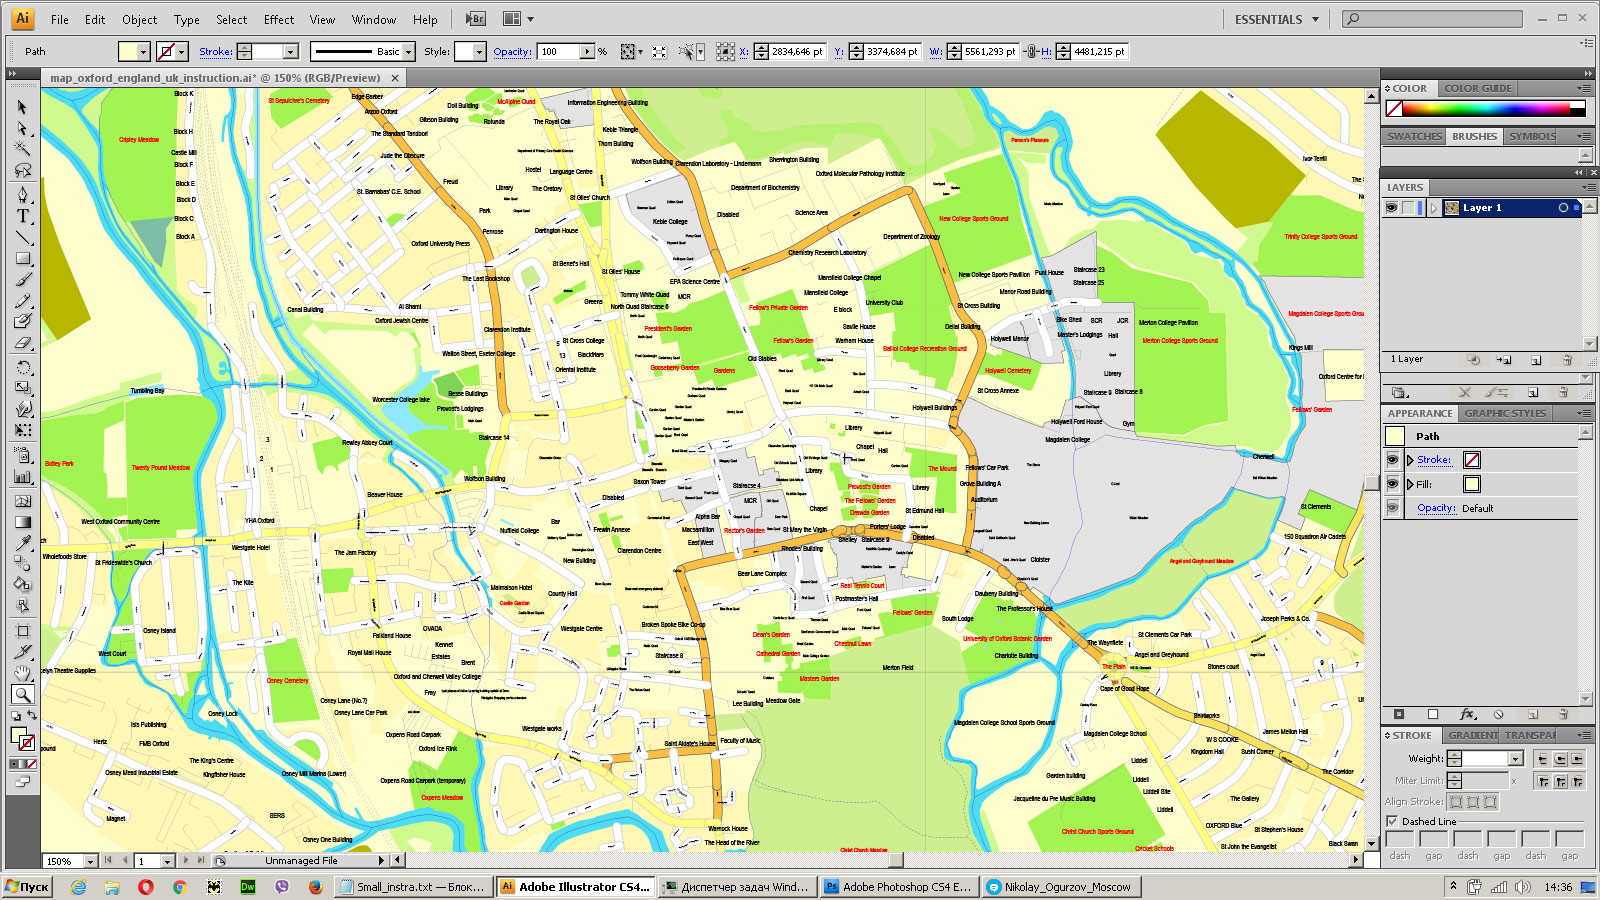
You can: Mass select objects by type and color – for example, the objects type “building” (they are usually dark gray) – and remove them from the map, if you do not need them in your print or design project. You can also easily change the thickness of lines (streets), just bulk selection the road by the line color.
The streets are separated by type, for example, type “residential road” are usually white with a gray stroke. Highway usually orange with a brown or dark gray stroke.
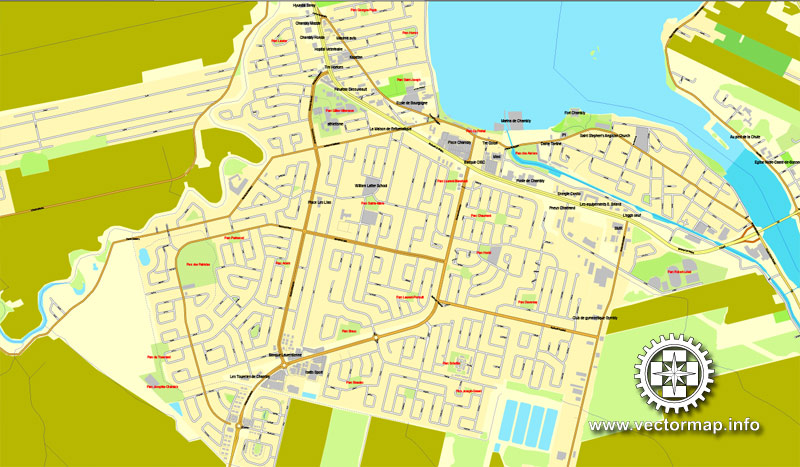
All objects are divided by types: different types of roads and streets, polygons of buildings, landfills, urban areas, parks and more other.
It is easy to change the font of inscriptions, all or each individually. Also, just can be make and any other manipulation of objects on the vector map in Adobe illustrator format.
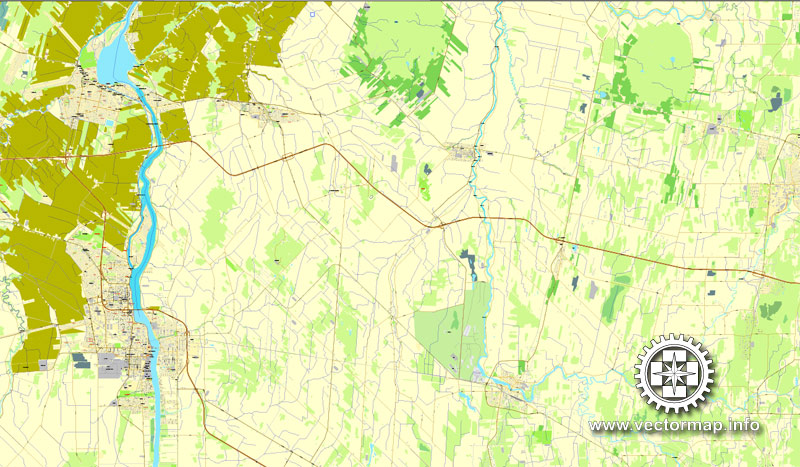
Important: All the proportions on the map are true, that is, the relative sizes of the objects are true, because Map is based on an accurate GPS projection, and It transated into the (usual for all) the Mercator projection.
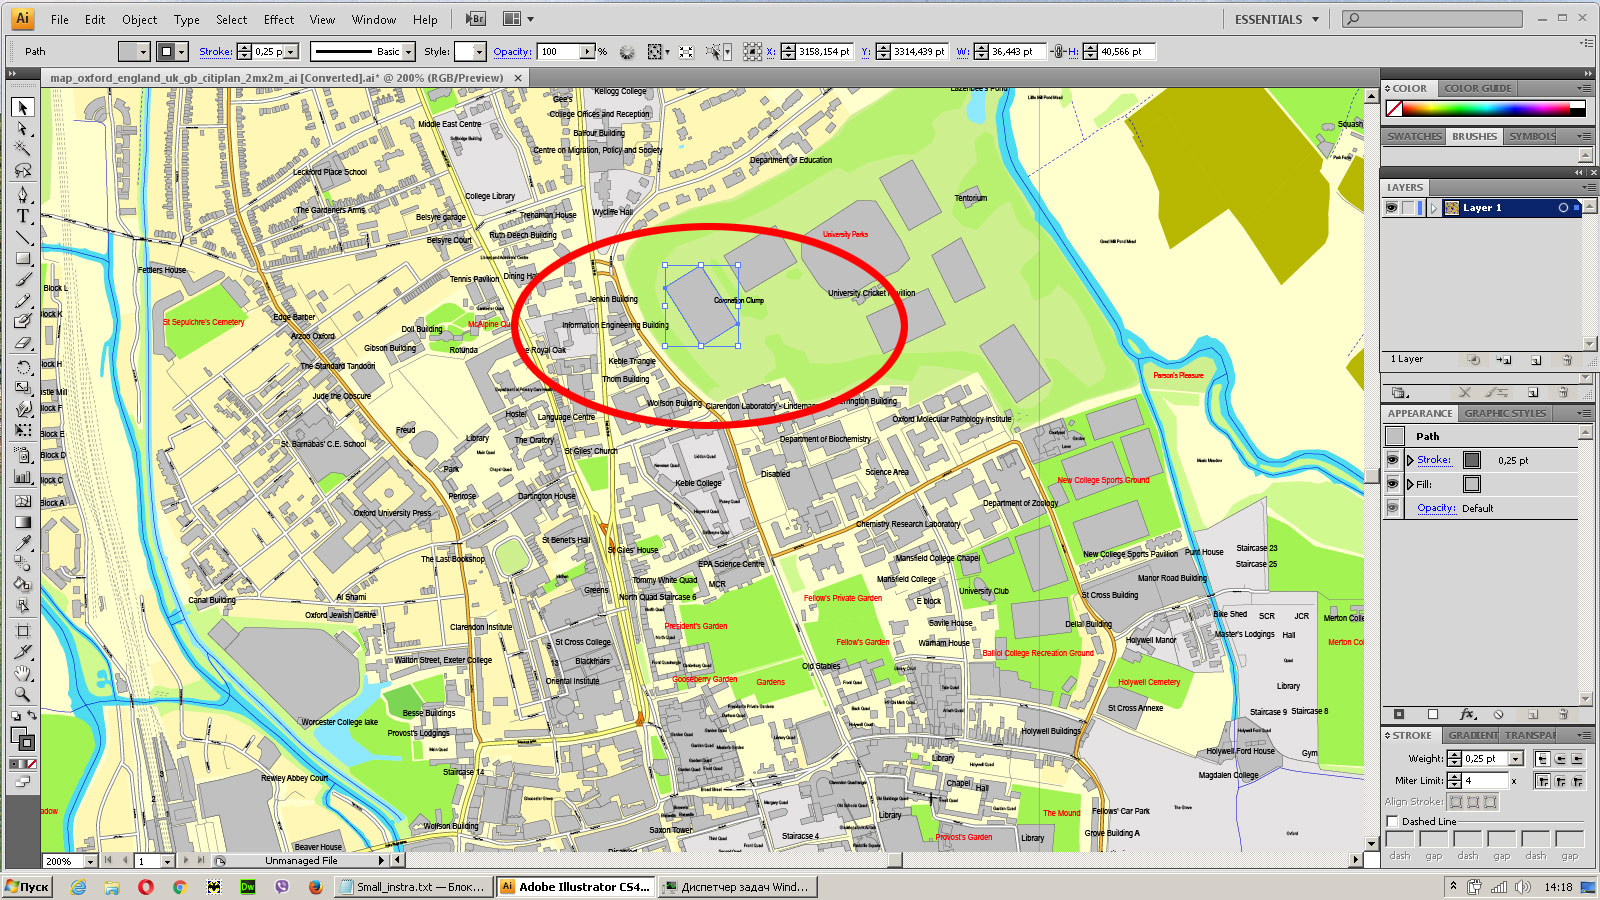
You can easily change the color, stroke and fill of any object on the map, zoom without loss of quality Image Verification.
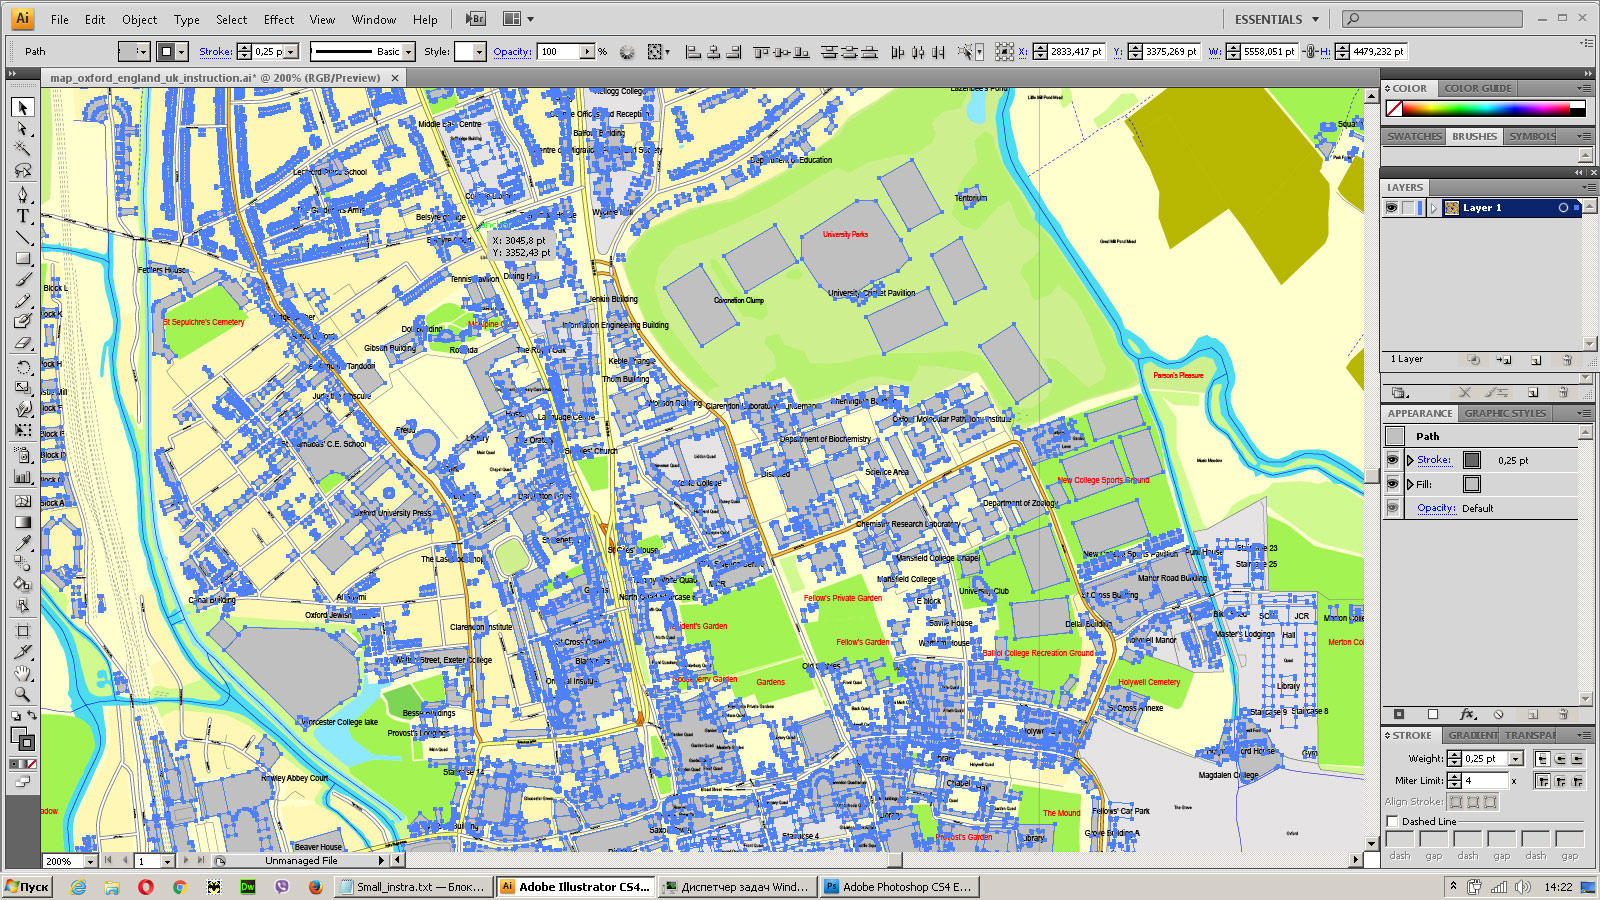
Select object
Bulk selection the same objects on the vector map
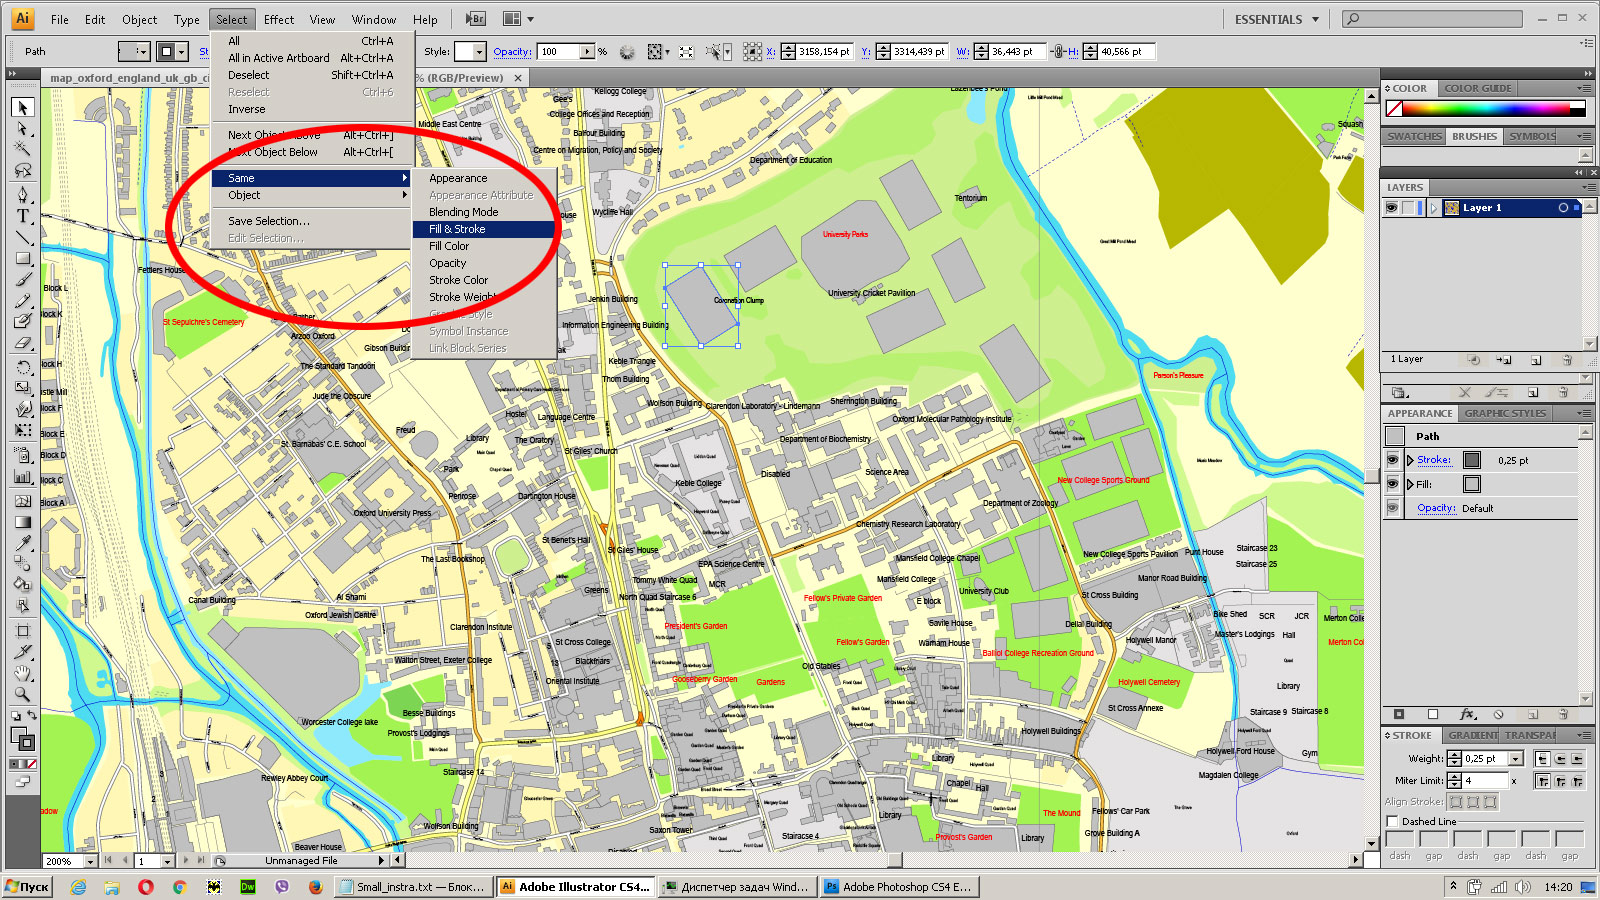
See the bulk selected objects on the vector map
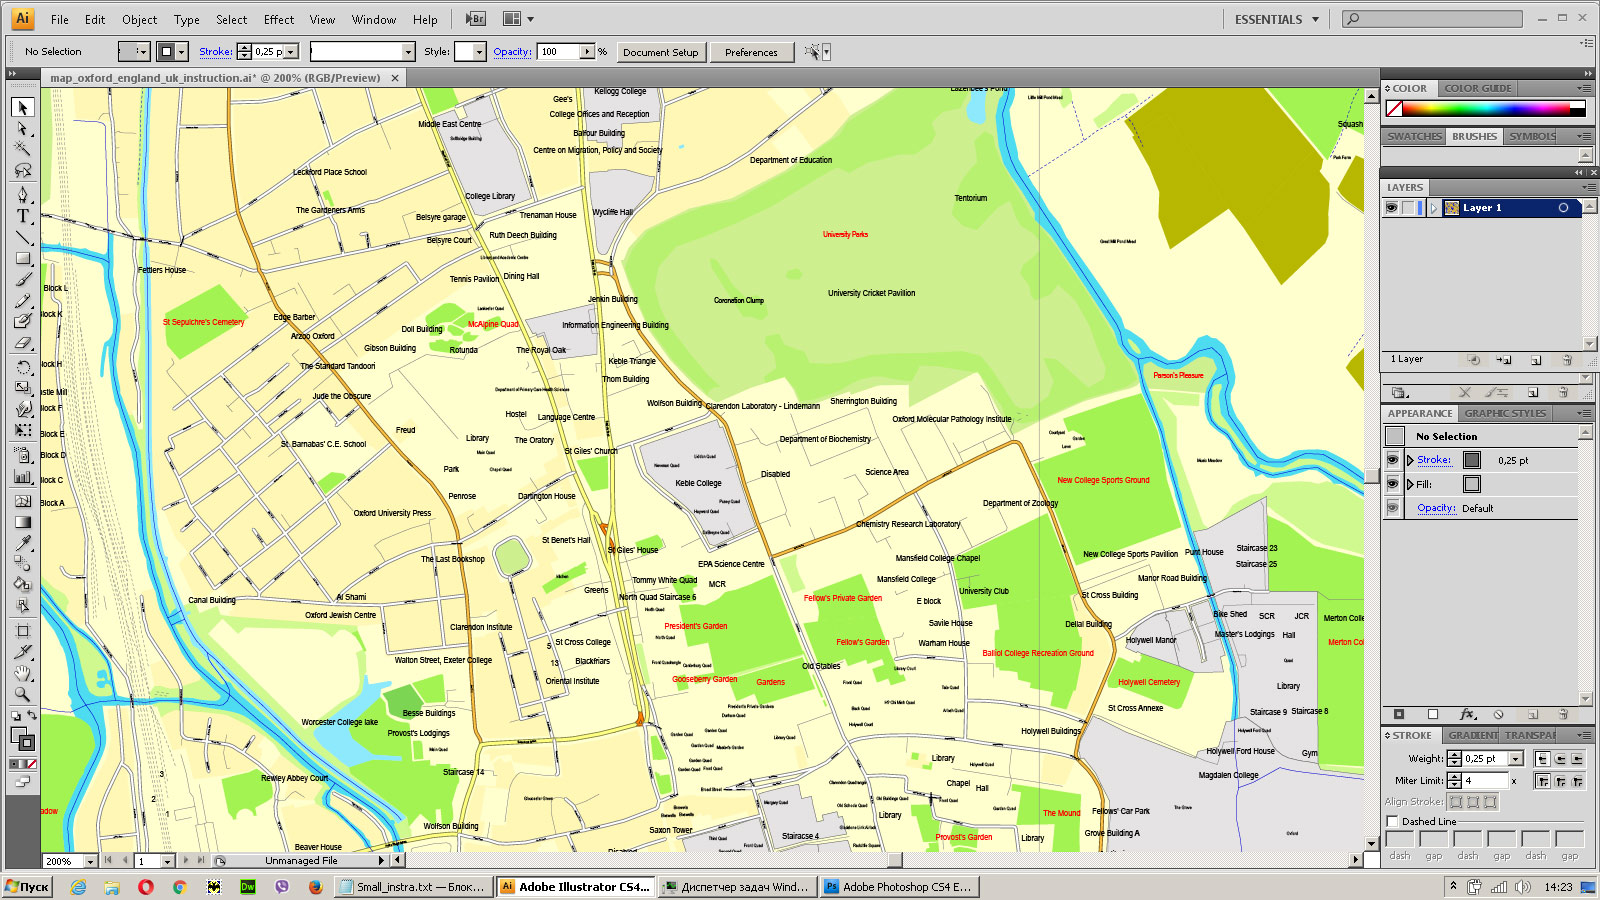
Bulk delete buildungs from the vector map
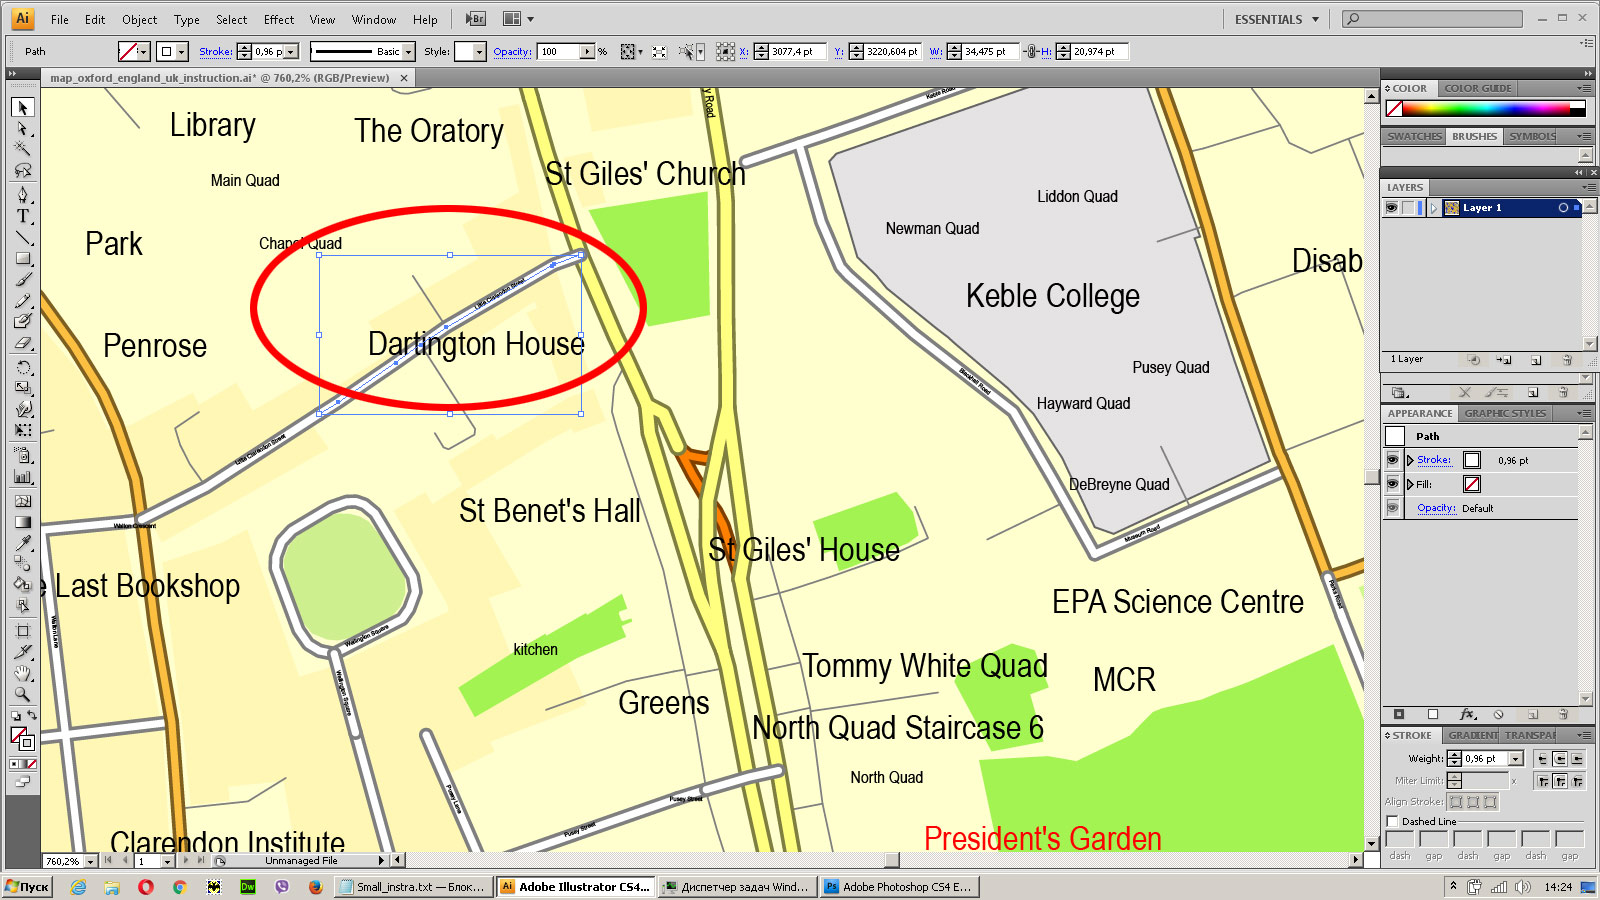
Select residencial road (small street) on the vector map
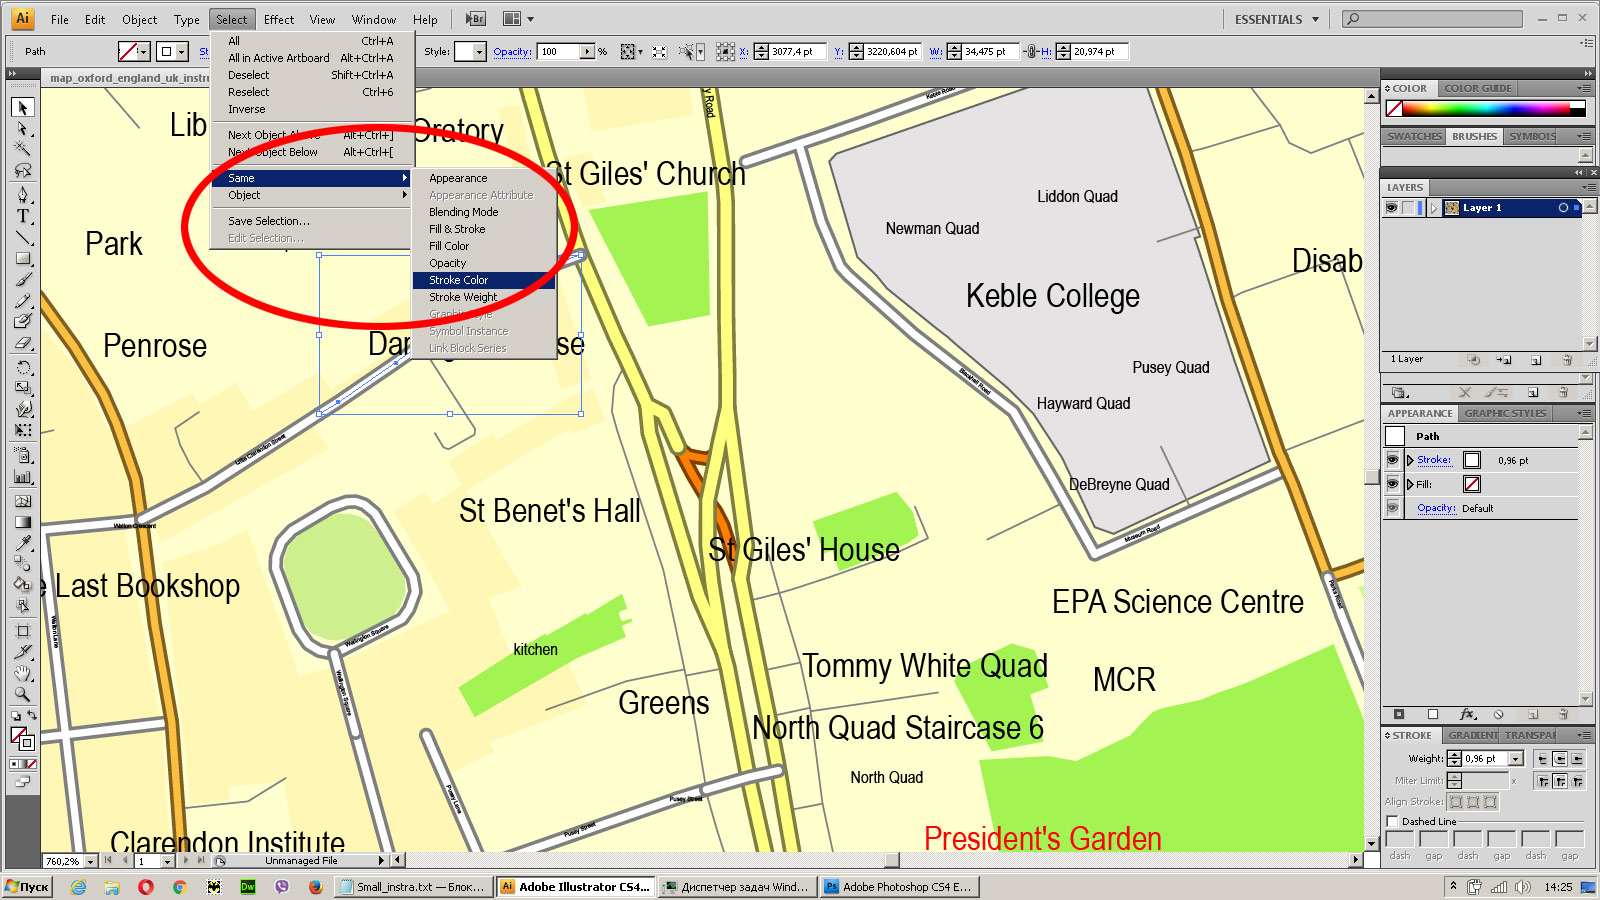
Bulk selection the same lines (streets, roads) on the full map
Create fat lines of the streets on the vector maps (bulk action) 1
Create fat lines of the streets on the vector maps (bulk action) 2

Create fat lines of the streets on the vector maps (bulk action) 3
You can easily change the color, stroke and fill of any object on the map, zoom without loss of quality Image Verification.
See more Canadian cities street maps for printing
For example: Printable Map Ottawa, Canada, exact vector street City Plan map
Quebec City, Canada, PDF Map, Printable G-View Level 17
Toronto printable vector street city plan map, Canada
PDF map of Vancouver, Canada
Montreal vector map and surroundings, Canada, printable

 Author: Kirill Shrayber, Ph.D. FRGS


