Houston vector map in [.AI] Adobe Illustrator
Archive size: 107 Mb
DPI: 300
License: Royalty Free
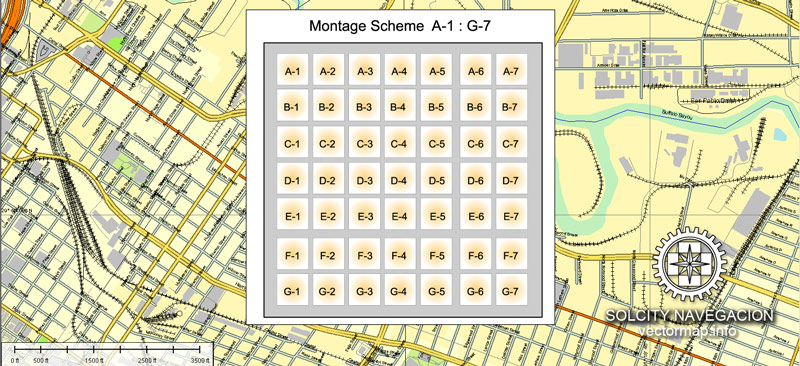
Content: Atlas 49 parts
This version is a full editable map, you can print it at any necessary size with no quality loss, cause is vector. Very accurate, can be purchased in different vector formats.
[Available in PDF and other formats: .DWG; .AI; .EPS; .CDR; .PPT.]
This Houston vector map features:
Highways with names,
Major streets with names,
Major Roads,
Dam,
Pipeline,
National Park Borders,
Airports,
Houses,
Railway lines with stops,
Latitude and Longitude data,
Minor Roads,
Private Roads,
Parking,
Cemeteries,
Big and small Rivers, small streams also,
Lake, ponds and other water bodies,
Landmark fill,
Recreation zones,
County Borders with fill,
Sidewalk/Walkway/Pedestrian roads,
Power Lines,
Parks.
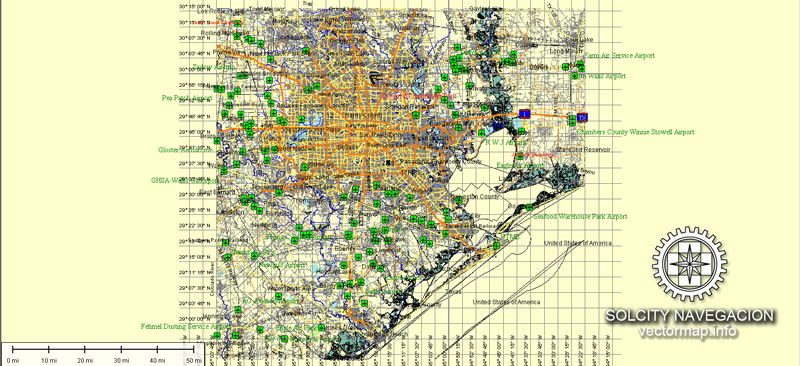
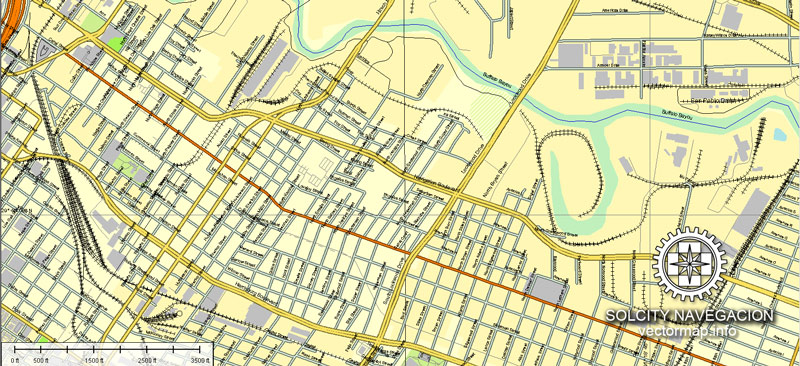
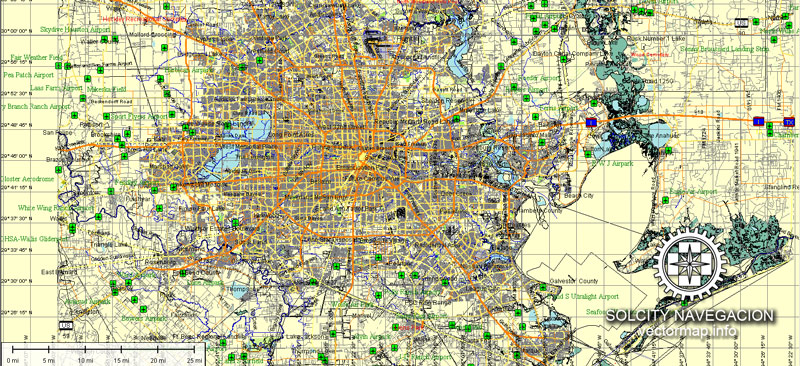
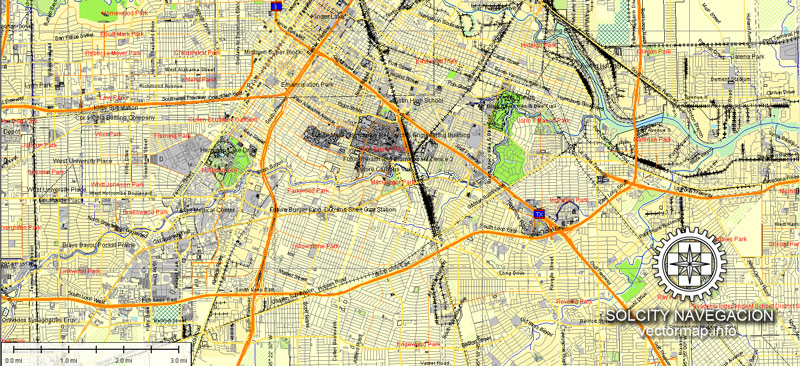
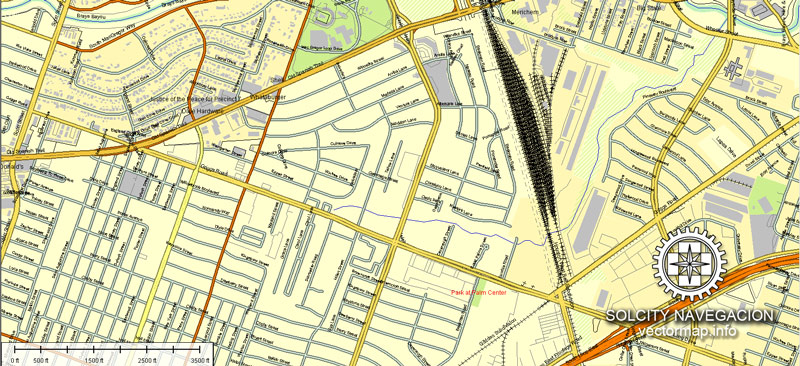
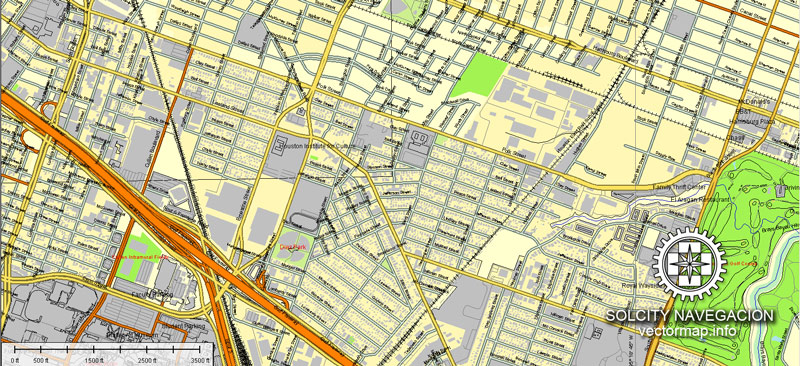
Please see the preview images uploaded above.
If you need some special data to be shown on map – just write or call us and we will add this layers with no extra cost. Remember, only with VectorMap Inc. Company :)
Houston, Texas, USA.
This vector map of Houston city is used as a basis for design, editing, and further printing.
This is the most detailed, exact map of Houston city for high-quality printing and polygraphy. You can always clarify the map development date by contacting us.
For your convenience, all objects on Houston vector city map are divided into layers. And the editing is very easy – colors, lines, etc.
You can easily add any objects needed (e.g. shops, salons, sale points, gas station or attraction) on any layer of Houston vector map.
Houston is the most populous city in the U.S. state of Texas and the fourth most populous city in the United States, with a census-estimated population of 2.312 million in 2017. It is the most populous city in the Southern United States and on the Gulf Coast of the United States. Located in Southeast Texas near Galveston Bay and the Gulf of Mexico, it is the seat of Harris County and the principal city of the Greater Houston metropolitan area, which is the fifth most populous metropolitan statistical area (MSA) in the United States and the second most populous in Texas after the Dallas-Fort Worth MSA.
One of the advantages of Houston city vector maps of our production is the relevance of cartographic data, we constantly update all our products.
This vector map of Houston city is used by:
designers, layout designers, printers, advertisers and architects. Our product – vector maps – is designed for further editing and printing in large formats – from @Wall format (a few meters) to A-0 and A-1, A-2, A-3.
The Houston city map in vector format is used for design, urban planning, presentations and media visualizations.
The advertising and presentation map of Houston city (usually the final designer marks the routes, and puts the client’s objects (shops, saloons, gas stations etc.)
The undoubted advantage is that people will NEVER throw out this advertising product – the map. In fact, as an advertising medium, a city map is the most “long-playing” of the well-known polygraphic advertising media, with the longest lifespan, and the maximum number of interactions with the customer.
With a total area of 627 square miles (1,620 km2), Houston is the eighth most expansive city in the United States (including consolidated city-counties; it is the largest city in the United States by total area, whose government is similarly not consolidated with that of a county or borough).
Houston was founded by land speculators on August 30, 1836, at the confluence of Buffalo Bayou and White Oak Bayou (a point now known as Allen’s Landing) and incorporated as a city on June 5, 1837. The city is named after former General Sam Houston, who was president of the Republic of Texas and had won Texas’ independence from Mexico at the Battle of San Jacinto 25 miles (40 km) east of Allen’s Landing.
For travelers, maps are sold at the airports and gas stations around the world. Often the source is our vector maps.
Take a look, who purchases our vector maps of Houston city in “Our Clients and Friends” page – these are large and small companies, from super-brands like Volvo and Starbucks, to small design studios and printing houses.
It’s very easy to work with vector maps of Houston city, even for a not very experienced designer who can turn on and off the map layers, add new objects, change the colors of fill and lines according to customer requirements.
The undoubted advantage of Houston city vector maps in printing is an excellent and detailed visualization, when customer can expand a large paper map and instantly define his location, find a landmark, an object or address on map, unlike using the popular electronic formats of Google and Yandex maps for example.
Printable vector maps of Houston city are much more convenient and efficient than any electronic maps on your smartphone, because ALL DETAILS are displayed in the entire space of Houston city map.
Useful tips on working with vector maps of cities and countries in Adobe Illustrator.
«V» – launches the Selection tool (cursor, black arrow), which makes active any vector line.
«А» – launches the Direct Selection tool (white cursor), allows you to select curve elements and drag them to the desired place.
«R» – activates the Rotate tool, which helps you rotating selected objects around the center point by 360 degrees.
«E» – gives you the opportunity to use the Eraser tool and erase unnecessary parts.
«X» – switches between Fill and Stroke in the Tools section. Try to get used to this hot key and
you will quickly understand that you can’t live and work without it.
Guides are not limited to vertical and horizontal in Adobe Illustrator. You can also create a diagonal guide for example. Moreover, you can turn any contours into guides. Select the outline and go to View > Guides > Make Guides (Create Guides), or simply press Cmd/Ctrl + 5. You can also turn the guides back into an editable object. Go to menu, View > Guides > Unlock Guides (Release Guides), select the guide you want to edit and select View > Guides > Release Guides (Reset Guides), or just press Cmd/Ctrl + Option / Alt + 5).
You will probably want to change the color scheme used on our Houston vector city map.
To quickly and effectively play with colors.
Of course, you can do it manually, all objects in our Houston city vector map are divided according to types and layers, and you can easily change the color gamma of vector objects in groups and layers.
But there is more effective way of working with the whole VECTOR MAP of Houston city and all layers:
The overview dialog «Edit colors»/«Repaint Graphic Object» (this dialog box name can change depending on the context):
If you have selected a part or a layer of Houston city vector map and open the dialog box by clicking the icon in the Control panel, on the Samples palette or the Color Catalog, or if you choose Edit > Edit Colors> Repaint Graphic Object, then the «Repaint Graphic Object» dialog box appears, and you get access to «Assign» and «Edit» tabs.
If a picture or a map fragment is not selected, and you open the dialog box by clicking the icon in the Control panel, on the Samples palette or in the Color Catalog, the «Edit Colors» dialog box appears and you can only access the «Edit» tab.
After briefly serving as the capital of the Texas Republic in the late 1830s, Houston grew steadily into a regional trading center for the remainder of the 19th century.
The arrival of the 20th century saw a convergence of economic factors which fueled rapid growth in Houston, including a burgeoning port and railroad industry, the decline of Galveston as Texas’ primary port following a devastating 1900 hurricane, the subsequent construction of the Houston Ship Channel, and the Texas oil boom. In the mid-20th century, Houston’s economy diversified as it became home to the Texas Medical Center—the world’s largest concentration of healthcare and research institutions—and NASA’s Johnson Space Center, where the Mission Control Center is located.
Regardless of the name at the top of the dialog box, the right-hand side always displays the color group of the current document, as well as two default color groups: Print Color and Grayscale. These color groups can be selected and used any time.
Create and edit color groups of Houston city vector map, and also assign colors using the «Edit Colors»/ а «Repaint Graphic Object» dialog box.
A. Creating and editing of a color group on the «Edit» tab
B. Assigning colors on the «Assign» tab
C. Select a group of colors from the «Color groups» list
The option «Repaint a graphic object» in the lower part of the dialog box allows you to preview the colors on a selected layer of Vector map, or a group of elements, and specify whether its colors will be redefined when the dialog box is closed.м

The main areas of the dialog box are:
«Edit»
The «Edit» tab is designed to create a new or edit the existing color groups.
The harmony rules Menu and the Color Wheel are used to conduct experiments with color harmonies. The color wheel shows how colors are related in color harmony, and the color bars allow you to view and manipulate an individual color values. In addition, you can adjust the brightness, add and remove colors, save color groups and view colors on the selected Vector Map of Houston city or a separated layers.
«Assign»
The «Assign» tab is used to view and control on how the original colors are replaced with colors from the color group like your corporate colors in the Vector Map of Houston city.
The assign color ability is provided only if the entire map, layer or fragment is selected in the document. You can specify which of new colors replace the current colors, whether the spot colors should be preserved and how colors are replaced (for example, you can replace colors completely or changing the color tone while maintaining the brightness). The «Assign» tab allows you to redefine colors in the Vector Map of Houston city, or in separate layers and fragments using the current color group or reducing the number of colors in the current Vector Map.
Color groups
Is a list of all saved color groups for current document (the same groups appear in the «Samples» palette). You can edit and delete the existing color groups, as well as creating a new ones using the list of “Color Groups” in the dialog box. All changes appear in the «Samples» palette.
The highlighted color group shows, which color group is currently edited.
Any color group can be selected and edited, or used to redefine the colors in the selected vector map of Houston city, its fragments or elements.
Saving a color group adds this group to the specified list.
Opening the «Edit Colors»/«Repaint Graphic Object» dialog box.
Open the «Edit Colors»/«Repaint Graphic Object» dialog box using one of the following methods:
«Edit»> «Edit Colors»> «Repaint Graphic object» or «Repaint With Style».
Use these commands if you need to edit the colors in the selected vector map of Houston city.
«Repaint Graphic object» button on the «Control» panel.
Use this button if you need to adjust colors of Houston city vector map using the а «Repaint graphic object» dialog box.
The specified button is available if the selected vector map or its fragment contains two or more colors.
Note. This color editing method is convenient for global color adjustment in a vector map, if global colors were not used when creating a City Map of Houston.
The «Edit colors» button or «Edit or apply colors» on the «Color Catalog» palette
Click this button if you need to edit colors on the «Color Catalog» palette or edit and then apply them to the selected Vector Map of Houston city or its fragment.
The «Edit color group» button or «Edit or apply color group» on the «Samples» palette.
Click this button if you need to edit the colors in the specific color group or edit and apply them to the selected Vector Map of Houston city or a group of its elements, for example, the whole layer “Streets and lines”. You can also double-click the color group in the Samples panel to open the dialog box.
If the map file is too large and your computer freezes or even can’t open it quickly:
1. Try to reduce the color resolution of the video card (display) to 256 colors while working with a large map.
2. Using Windows Task Manager, select all the application you don’t need, while working with map, just turn them off.
3. Launch Adobe Illustrator. (DO NOT OPEN the vector map file)
4. Start the Windows Task Manager using administrator rights > Find the “Illustrator” process > set the «real time» priority,
5. Open the file. When you see the LEGACY FONT popup window – click “OK” (do not update). You can restore the TEXT later.
6. Can also be useful: When file is opened – Edit > Settings > Basic Settings > disable smoothing. /// It looks scary, but works quickly)))
We recommend saving the file in Adobe Illustrator 10 version. It’s much more stable when working with VERY BIG size files.
Houston’s economy has a broad industrial base in energy, manufacturing, aeronautics, and transportation. Leading in healthcare sectors and building oilfield equipment, Houston has the second most Fortune 500 headquarters of any U.S. municipality within its city limits (after New York City). The Port of Houston ranks first in the United States in international waterborne tonnage handled and second in total cargo tonnage handled. Nicknamed the “Space City”, Houston is a global city, with strengths in culture, medicine, and research. The city has a population from various ethnic and religious backgrounds and a large and growing international community. Houston is the most diverse metropolitan area in Texas and has been described as the most racially and ethnically diverse major metropolis in the U.S. It is home to many cultural institutions and exhibits, which attract more than 7 million visitors a year to the Museum District. Houston has an active visual and performing arts scene in the Theater District and offers year-round resident companies in all major performing arts.
Geography
Houston is located 165 miles (266 km) east of Austin, 88 miles (142 km) west of the Louisiana border, and 250 miles (400 km) south of Dallas. The city has a total area of 627 square miles (1,620 km2); this comprises 599.59 square miles (1,552.9 km2) of land and 22.3 square miles (58 km2) covered by water. The Piney Woods are north of Houston. Most of Houston is located on the gulf coastal plain, and its vegetation is classified as temperate grassland and forest. Much of the city was built on forested land, marshes, swamp, or prairie and are all still visible in surrounding areas. Flat terrain and extensive greenfield development have combined to worsen flooding. Downtown stands about 50 feet (15 m) above sea level, and the highest point in far northwest Houston is about 125 feet (38 m) in elevation. The city once relied on groundwater for its needs, but land subsidence forced the city to turn to ground-level water sources such as Lake Houston, Lake Conroe, and Lake Livingston. The city owns surface water rights for 1.20 billion gallons of water a day in addition to 150 million gallons a day of groundwater.
Houston has four major bayous passing through the city that accept water from the extensive drainage system. Buffalo Bayou runs through downtown and the Houston Ship Channel, and has three tributaries: White Oak Bayou, which runs through the Houston Heights community northwest of Downtown and then towards Downtown; Brays Bayou, which runs along the Texas Medical Center; and Sims Bayou, which runs through the south of Houston and downtown Houston. The ship channel continues past Galveston and then into the Gulf of Mexico.
Houston, the most populous city in the Southern United States, is located along the upper Texas Gulf Coast, approximately 50 miles (80 km) northwest of the Gulf of Mexico at Galveston. The city, which is the ninth-largest in the United States by area, covers 601.7 square miles (1,558 km2), of which 579.4 square miles (1,501 km2), or 96.3%, is land and 22.3 square miles (58 km2), or 3.7%, is water.
Houston is located in the Gulf Coastal Plain biome, and its vegetation is classified as temperate grassland. Much of the city was built on marshes, forested land, swamp, or prairie, all of which can still be seen in surrounding areas.
The city’s topography is very flat, making flooding a recurring problem for its residents. The city stands about 50 feet (15 m) above sea level—the highest area within city limits being 90 feet (27 m). However, subsidence, caused by extensive groundwater pumping and resource extraction, has caused the elevation to drop 10 feet (3.0 m) or more in certain areas. As a result, the city turned to surface water sources for its municipal supply, creating reservoirs such as Lake Houston and Lake Conroe (of which Houston owns two-thirds interest).
Houston has four major bayous passing through the city: Buffalo Bayou, which runs into downtown and the Houston Ship Channel; and three of its tributaries: Brays Bayou, which runs along the Texas Medical Center; White Oak Bayou, which runs through the Heights and near the northwest area; and Sims Bayou, which runs through the south of Houston and downtown Houston. The ship channel goes past Galveston and into the Gulf of Mexico.
Houston is located 165 miles (266 km) east of Austin, 112 miles (180 km) west of the Louisiana border and 250 miles (400 km) south of Dallas.
When Houston was established in 1837, the city’s founders—John Kirby Allen and Augustus Chapman Allen—divided it into political geographic districts called “wards.” The ward designation is the progenitor of the current-day Houston City Council districts—there are nine in all.
Locations in Houston are generally classified as either being inside or outside Interstate 610, known as the “610 Loop” or simply “The Loop”. Inside the loop generally encompasses the central business district, and has come to define an urban lifestyle and state of mind. The appellation “inner looper” carries with it the expectation of someone who appreciates cosmopolitan-style city life. Elizabeth Long, the author of the 2003 book Book Clubs: Women and the Uses of Reading in Everyday Life, wrote that most of the upper middle classes in the 610 Loop live in the southwestern part of the inner city in the areas near Hermann Park, the Houston Museum District, Rice University, and the Texas Medical Center, while some portions of northern Houston and Eastern Houston have been gentrified and also have upper middle classes.
The outlying areas of Houston, the airports and the city’s suburbs and enclaves are outside the Loop. Another ring road, Beltway 8 (also known simply as the “Beltway” or as the “Sam Houston Tollway”), encircles the city another 5 miles (8 km) farther out. Parts of Beltway 8 are toll roads, but for most of the route motorists can drive in the adjacent “feeder” or service roads at no charge. Farm to Market Road 1960 (FM 1960) forms a semicircle in northern Houston and is another dividing line. The third ring road, State Highway 99 (also known as the Grand Parkway), is under construction. Long stated that most of the wealthier Houston suburbs are west and north of the central city, while to the southeast the Clear Lake/NASA ” another burgeoning concentration of largely aerospace-related prosperity”.
Houston, being the largest city in the United States without zoning laws, has grown in an unusual manner. Rather than a single “downtown” as the center of the city’s employment, five additional business districts have grown throughout the inner-city—they are Uptown, Texas Medical Center, Greenway Plaza, Westchase, and Greenspoint. If these business districts were combined, they would form the third-largest downtown in the United States. The city also has the third-largest skyline in the country (after New York City and Chicago), but because it is spread over a few miles, pictures of the city show—for the most part—the main downtown area. The growth of the Greater Houston area has occurred from all directions from the city core.
Houston city vectorial map (Texas). Cities and counties near
Our vector map of Houston also includes maps of the nearest counties and cities (see the preview):
Brookshire, Simonton, Katy, Fulshear, Orchard, Richmond, Rosenberg, Needville, Beasley, Greatwood, Kendleton, Sugar Land, Cinco Ranch, English, Fresno, Sienna Plantation, Manvel, Alvin, Santa Fe, Greatwood, Friendswood, League city, La porte, Channelview, Pasadena, Kemah, Aldine, Sheldon, Jersey Village, Barret, Crosby, Highlands, Baytown, Seabrook, Humble.
Houston map for Illustrator. Purchase and download
It`s a Royalty Free license. What does it mean? You can make as many copies as you want, also realize editing and printing actions with no extra fee.
We accept PayPal and Credit Card payment. After the payment you will be redirected to the download page.
VectorMap. Providing high quality vector maps. Enjoy!
Small guide: How to work with the vector map?
You can: Mass select objects by type and color – for example, the objects type “building” (they are usually dark gray) – and remove them from the map, if you do not need them in your print or design project. You can also easily change the thickness of lines (streets), just bulk selection the road by the line color.
The streets are separated by type, for example, type “residential road” are usually white with a gray stroke. Highway usually orange with a brown or dark gray stroke.
All objects are divided by types: different types of roads and streets, polygons of buildings, landfills, urban areas, parks and more other.
It is easy to change the font of inscriptions, all or each individually. Also, just can be make and any other manipulation of objects on the vector map in Adobe illustrator format.
Important: All the proportions on the map are true, that is, the relative sizes of the objects are true, because Map is based on an accurate GPS projection, and It transated into the (usual for all) the Mercator projection.
You can easily change the color, stroke and fill of any object on the map, zoom without loss of quality Image Verification.


 Author: Kirill Shrayber, Ph.D. FRGS

