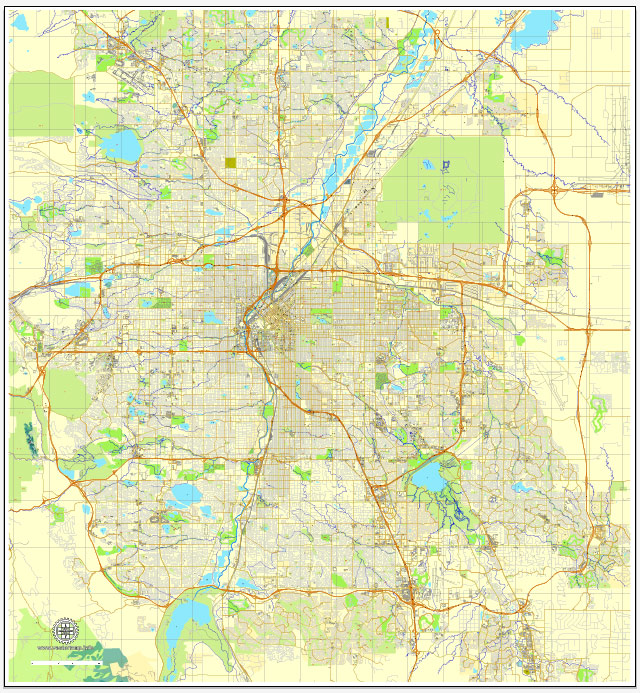
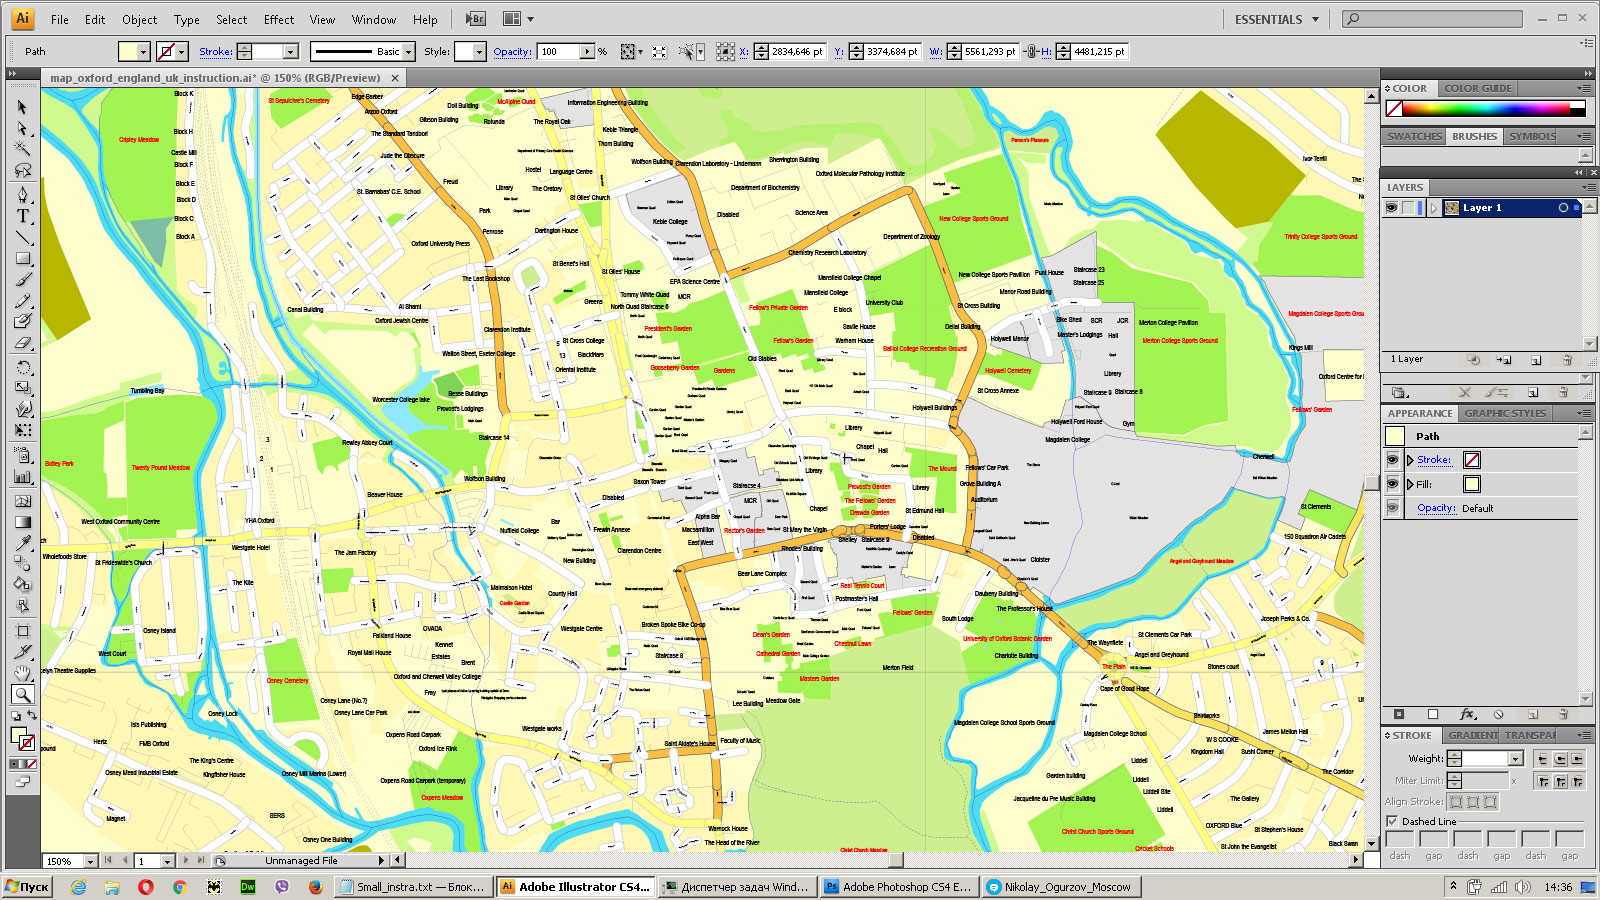
Denver, Colorado, Printable map, US vector street City Plan map, full editable, Adobe Illustrator, V3.10 full vector, scalable, editable, text format street names, 22 Mb ZIP.
All streets, NO buildings. Map for design, print, arts, projects, presentations.
PDF, DXF, CDR and other formats – on request, same price, please, contact.
Denver, Colorado, USA.
This vector map of Denver city is used as a basis for design, editing, and further printing.
This is the most detailed, exact map of Denver city for high-quality printing and polygraphy. You can always clarify the map development date by contacting us.
For your convenience, all objects on Denver vector city map are divided into layers. And the editing is very easy – colors, lines, etc.
You can easily add any objects needed (e.g. shops, salons, sale points, gas station or attraction) on any layer of Denver vector map.
Denver is the capital and most populous municipality of the U.S. state of Colorado. Denver is located in the South Platte River Valley on the western edge of the High Plains just east of the Front Range of the Rocky Mountains.
One of the advantages of Denver city vector maps of our production is the relevance of cartographic data, we constantly update all our products.
This vector map of Denver city is used by:
designers, layout designers, printers, advertisers and architects. Our product – vector maps – is designed for further editing and printing in large formats – from @Wall format (a few meters) to A-0 and A-1, A-2, A-3.
The Denver city map in vector format is used for design, urban planning, presentations and media visualizations.
The advertising and presentation map of Denver city (usually the final designer marks the routes, and puts the client’s objects (shops, saloons, gas stations etc.)
The undoubted advantage is that people will NEVER throw out this advertising product – the map. In fact, as an advertising medium, a city map is the most “long-playing” of the well-known polygraphic advertising media, with the longest lifespan, and the maximum number of interactions with the customer.
The Denver downtown district is immediately east of the confluence of Cherry Creek with the South Platte River, approximately 12 mi (19 km) east of the foothills of the Rocky Mountains. Denver is nicknamed the Mile High City because its official elevation is exactly one mile (5280 feet or 1609.3 meters) above sea level. The 105th meridian west of Greenwich, the longitudinal reference for the Mountain Time Zone, passes directly through Denver Union Station.
For travelers, maps are sold at the airports and gas stations around the world. Often the source is our vector maps.
Take a look, who purchases our vector maps of Denver city in “Our Clients and Friends” page – these are large and small companies, from super-brands like Volvo and Starbucks, to small design studios and printing houses.
It’s very easy to work with vector maps of Denver city, even for a not very experienced designer who can turn on and off the map layers, add new objects, change the colors of fill and lines according to customer requirements.
The undoubted advantage of Denver city vector maps in printing is an excellent and detailed visualization, when customer can expand a large paper map and instantly define his location, find a landmark, an object or address on map, unlike using the popular electronic formats of Google and Yandex maps for example.
Printable vector maps of Denver city are much more convenient and efficient than any electronic maps on your smartphone, because ALL DETAILS are displayed in the entire space of Denver city map.
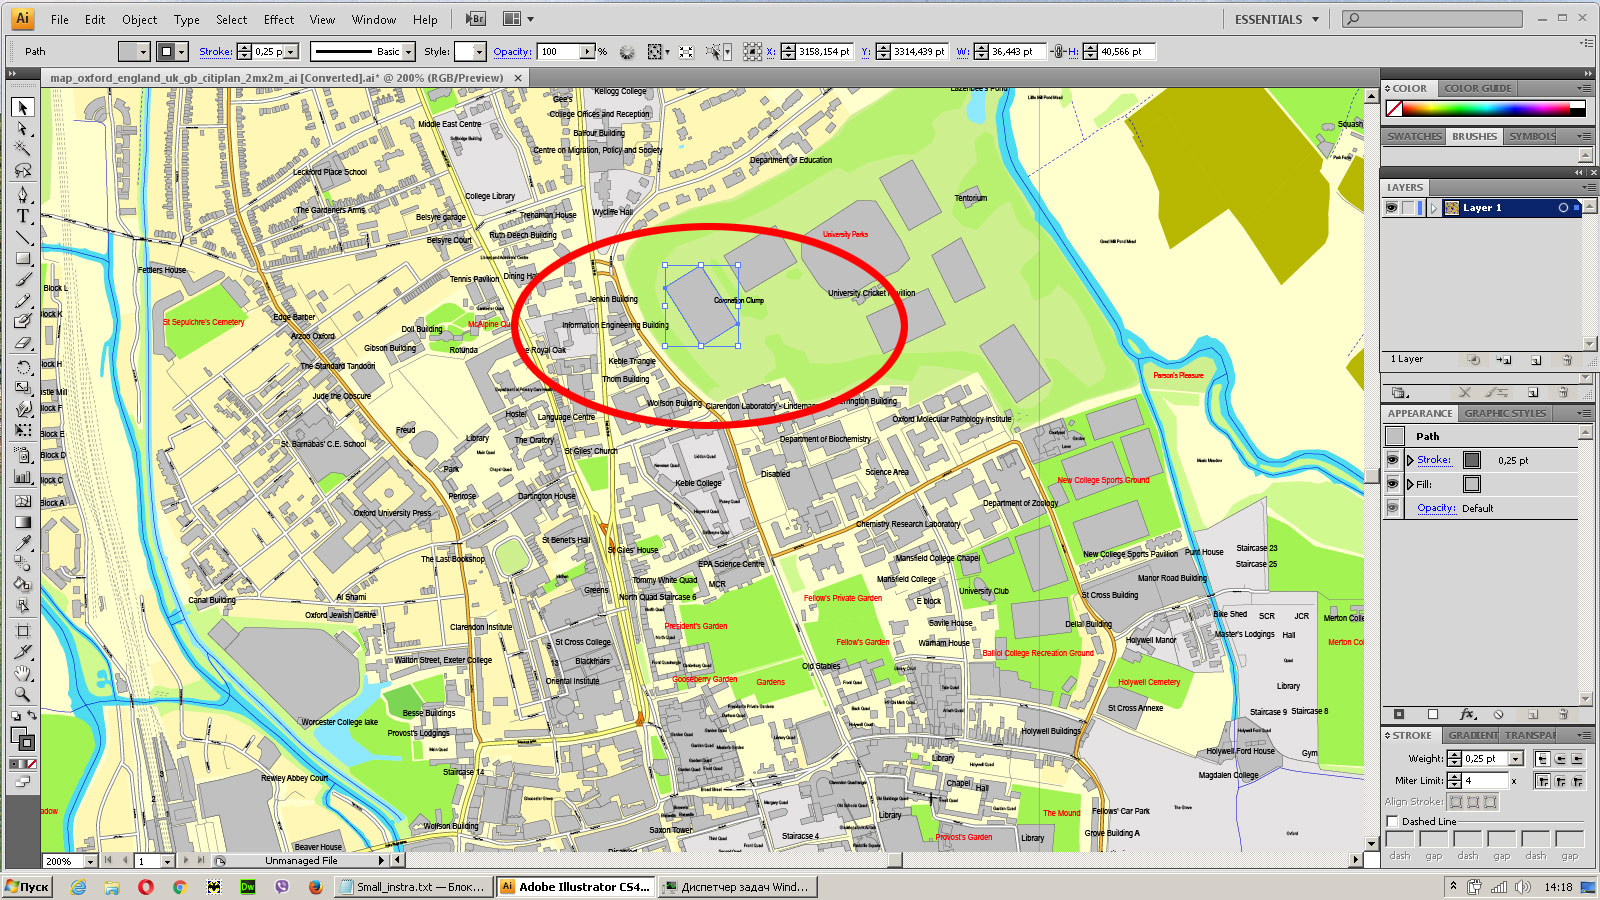
Useful tips on working with vector maps of cities and countries in Adobe Illustrator.
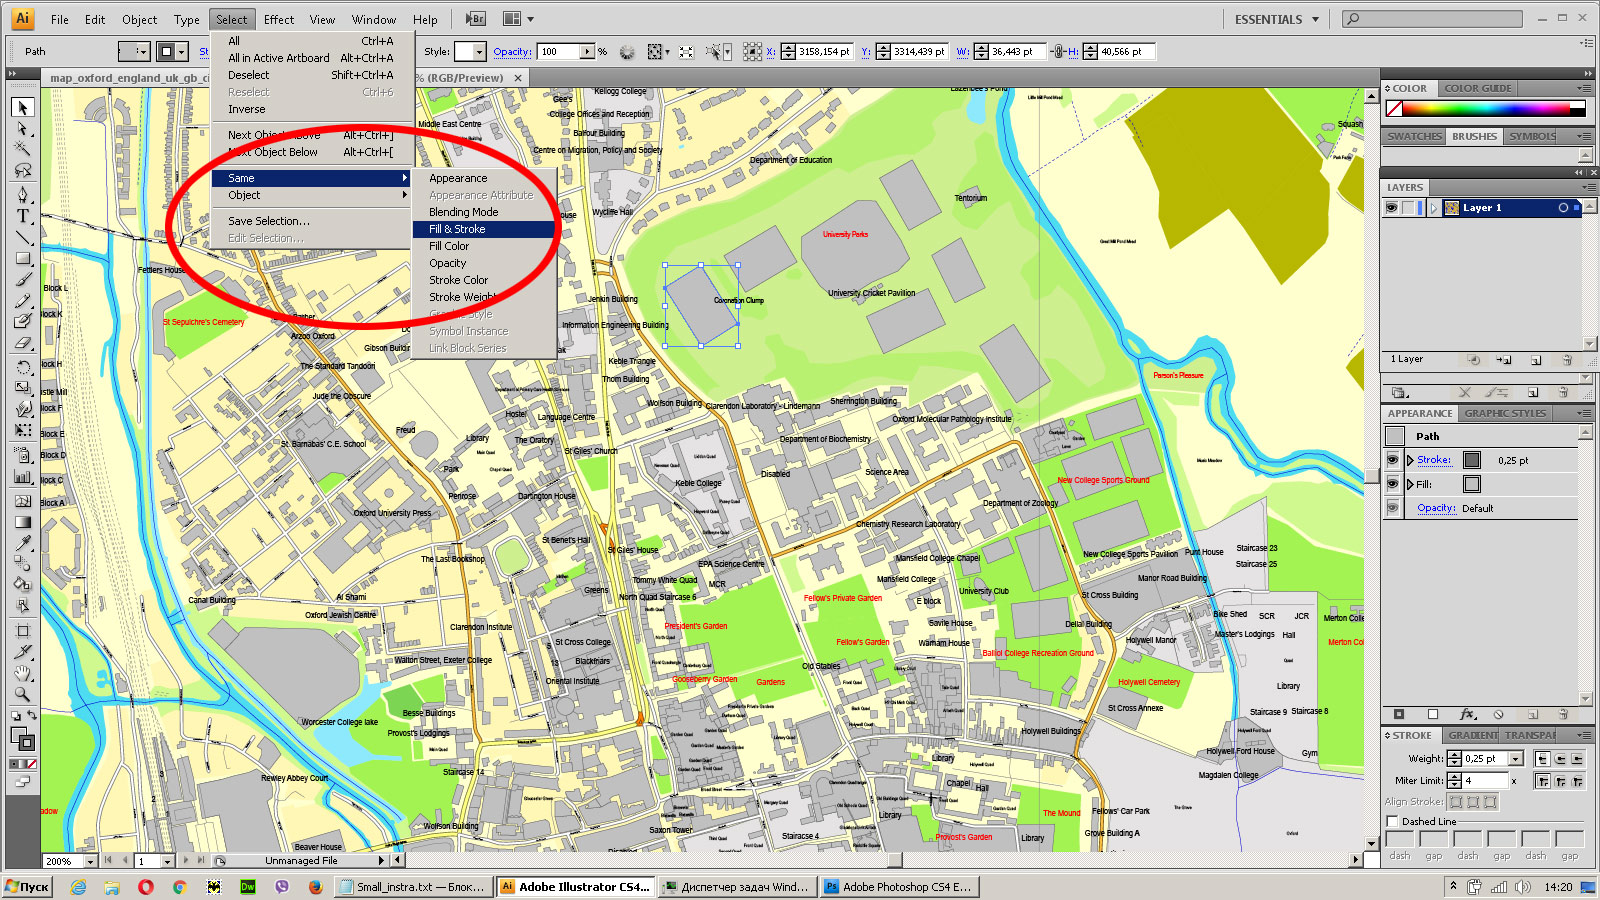
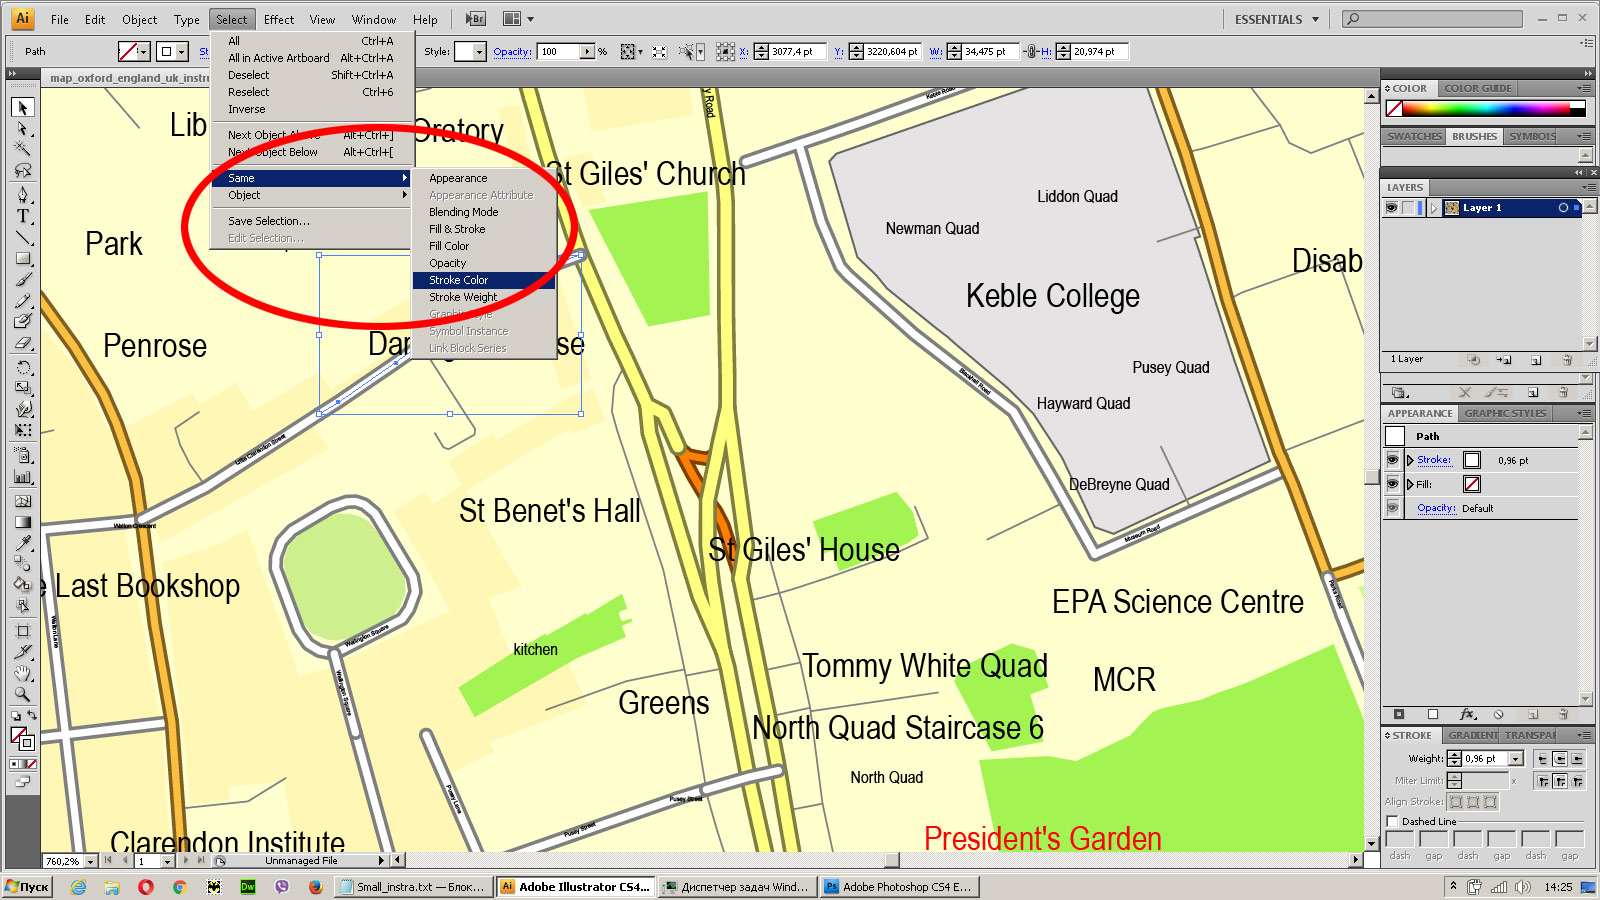
«V» – launches the Selection tool (cursor, black arrow), which makes active any vector line.
«А» – launches the Direct Selection tool (white cursor), allows you to select curve elements and drag them to the desired place.
«R» – activates the Rotate tool, which helps you rotating selected objects around the center point by 360 degrees.
«E» – gives you the opportunity to use the Eraser tool and erase unnecessary parts.
«X» – switches between Fill and Stroke in the Tools section. Try to get used to this hot key and
you will quickly understand that you can’t live and work without it.
Denver is ranked as a Beta- world city by the Globalization and World Cities Research Network. With an estimated population of 704,621 in 2017, Denver is the 19th-most populous U.S. city, and with a 17.41% increase since the 2010 United States Census, it has been one of the fastest-growing major cities in the United States.
Guides are not limited to vertical and horizontal in Adobe Illustrator. You can also create a diagonal guide for example. Moreover, you can turn any contours into guides. Select the outline and go to View > Guides > Make Guides (Create Guides), or simply press Cmd/Ctrl + 5. You can also turn the guides back into an editable object. Go to menu, View > Guides > Unlock Guides (Release Guides), select the guide you want to edit and select View > Guides > Release Guides (Reset Guides), or just press Cmd/Ctrl + Option / Alt + 5).
You will probably want to change the color scheme used on our Denver vector city map.
To quickly and effectively play with colors.
Of course, you can do it manually, all objects in our Denver city vector map are divided according to types and layers, and you can easily change the color gamma of vector objects in groups and layers.
The 10-county Denver-Aurora-Lakewood, CO Metropolitan Statistical Area had an estimated 2017 population of 2,888,227 and is the 19th most populous U.S. metropolitan statistical area. The 12-city Denver-Aurora, CO Combined Statistical Area had an estimated 2017 population of 3,515,374 and is the 15th most populous U.S. metropolitan area. Denver is the most populous city of the 18-county Front Range Urban Corridor, an oblong urban region stretching across two states with an estimated 2017 population of 4,895,589. Denver is the most populous city within a 500-mile (800 km) radius and the second-most populous city in the Mountain West after Phoenix, Arizona. In 2016, Denver was named the best place to live in the United States by U.S. News & World Report.
But there is more effective way of working with the whole VECTOR MAP of Denver city and all layers:
The overview dialog «Edit colors»/«Repaint Graphic Object» (this dialog box name can change depending on the context):
If you have selected a part or a layer of Denver city vector map and open the dialog box by clicking the icon in the Control panel, on the Samples palette or the Color Catalog, or if you choose Edit > Edit Colors> Repaint Graphic Object, then the «Repaint Graphic Object» dialog box appears, and you get access to «Assign» and «Edit» tabs.
If a picture or a map fragment is not selected, and you open the dialog box by clicking the icon in the Control panel, on the Samples palette or in the Color Catalog, the «Edit Colors» dialog box appears and you can only access the «Edit» tab.
Regardless of the name at the top of the dialog box, the right-hand side always displays the color group of the current document, as well as two default color groups: Print Color and Grayscale. These color groups can be selected and used any time.
Create and edit color groups of Denver city vector map, and also assign colors using the «Edit Colors»/ а «Repaint Graphic Object» dialog box.
A. Creating and editing of a color group on the «Edit» tab
B. Assigning colors on the «Assign» tab
C. Select a group of colors from the «Color groups» list
The option «Repaint a graphic object» in the lower part of the dialog box allows you to preview the colors on a selected layer of Vector map, or a group of elements, and specify whether its colors will be redefined when the dialog box is closed.
The main areas of the dialog box are:
«Edit»
The «Edit» tab is designed to create a new or edit the existing color groups.
The harmony rules Menu and the Color Wheel are used to conduct experiments with color harmonies. The color wheel shows how colors are related in color harmony, and the color bars allow you to view and manipulate an individual color values. In addition, you can adjust the brightness, add and remove colors, save color groups and view colors on the selected Vector Map of Denver city or a separated layers.
Geography
Denver is in the center of the Front Range Urban Corridor, between the Rocky Mountains to the west and the High Plains to the east. Denver’s topography consists of plains in the city center with hilly areas to the north, west and south. According to the United States Census Bureau the city has a total area of 155 square miles (401 km2), of which 153 square miles (396 km2) is land and 1.6 square miles (4.1 km2) (1.1%) is water. The City and County of Denver is surrounded by only three other counties: Adams County to the north and east, Arapahoe County to the south and east, and Jefferson County to the west.
«Assign»
The «Assign» tab is used to view and control on how the original colors are replaced with colors from the color group like your corporate colors in the Vector Map of Denver city.
The assign color ability is provided only if the entire map, layer or fragment is selected in the document. You can specify which of new colors replace the current colors, whether the spot colors should be preserved and how colors are replaced (for example, you can replace colors completely or changing the color tone while maintaining the brightness). The «Assign» tab allows you to redefine colors in the Vector Map of Denver city, or in separate layers and fragments using the current color group or reducing the number of colors in the current Vector Map.
Although Denver’s nickname is the “Mile-High City” because its official elevation is one mile above sea level, defined by the elevation of the spot of a benchmark on the steps of the State Capitol building, the elevation of the entire city ranges from 5,130 to 5,690 feet (1,560 to 1,730 m). According to Geographic Names Information System (GNIS) and the National Elevation Dataset, the city’s elevation is 5,278 feet (1,609 m), which is reflected on various websites such as the National Weather Service.
Color groups
Is a list of all saved color groups for current document (the same groups appear in the «Samples» palette). You can edit and delete the existing color groups, as well as creating a new ones using the list of “Color Groups” in the dialog box. All changes appear in the «Samples» palette.
The highlighted color group shows, which color group is currently edited.
Any color group can be selected and edited, or used to redefine the colors in the selected vector map of Denver city, its fragments or elements.
Saving a color group adds this group to the specified list.
Opening the «Edit Colors»/«Repaint Graphic Object» dialog box.
Open the «Edit Colors»/«Repaint Graphic Object» dialog box using one of the following methods:
«Edit»> «Edit Colors»> «Repaint Graphic object» or «Repaint With Style».
Neighborhoods
As of January 2013, the City and County of Denver has defined 78 official neighborhoods that the city and community groups use for planning and administration. Although the city’s delineation of the neighborhood boundaries is somewhat arbitrary, it corresponds roughly to the definitions used by residents. These “neighborhoods” should not be confused with cities or suburbs, which may be separate entities within the metro area.
Use these commands if you need to edit the colors in the selected vector map of Denver city.
«Repaint Graphic object» button on the «Control» panel.
Use this button if you need to adjust colors of Denver city vector map using the а «Repaint graphic object» dialog box.
The specified button is available if the selected vector map or its fragment contains two or more colors.
Note. This color editing method is convenient for global color adjustment in a vector map, if global colors were not used when creating a City Map of Denver.
The «Edit colors» button or «Edit or apply colors» on the «Color Catalog» palette
Click this button if you need to edit colors on the «Color Catalog» palette or edit and then apply them to the selected Vector Map of Denver city or its fragment.
The «Edit color group» button or «Edit or apply color group» on the «Samples» palette.
The character of the neighborhoods varies significantly from one to another and includes everything from large skyscrapers to houses from the late 19th century to modern, suburban-style developments. Generally, the neighborhoods closest to the city center are denser, older and contain more brick building material. Many neighborhoods away from the city center were developed after World War II, and are built with more modern materials and style. Some of the neighborhoods even farther from the city center, or recently redeveloped parcels anywhere in the city, have either very suburban characteristics or are new urbanist developments that attempt to recreate the feel of older neighborhoods. Most neighborhoods contain parks or other features that are the focal point of the neighborhood.
Click this button if you need to edit the colors in the specific color group or edit and apply them to the selected Vector Map of Denver city or a group of its elements, for example, the whole layer “Streets and lines”. You can also double-click the color group in the Samples panel to open the dialog box.
If the map file is too large and your computer freezes or even can’t open it quickly:
1. Try to reduce the color resolution of the video card (display) to 256 colors while working with a large map.
2. Using Windows Task Manager, select all the application you don’t need, while working with map, just turn them off.
3. Launch Adobe Illustrator. (DO NOT OPEN the vector map file)
4. Start the Windows Task Manager using administrator rights > Find the “Illustrator” process > set the «real time» priority,
5. Open the file. When you see the LEGACY FONT popup window – click “OK” (do not update). You can restore the TEXT later.
6. Can also be useful: When file is opened – Edit > Settings > Basic Settings > disable smoothing. /// It looks scary, but works quickly)))
We recommend saving the file in Adobe Illustrator 10 version. It’s much more stable when working with VERY BIG size files.
Denver does not have larger area designations, unlike the City of Chicago, which has larger areas that house the neighborhoods (IE: Northwest Side). Denver residents use the terms “north”, “south”, “east”, and “west”.
Denver also has a number of neighborhoods not reflected in the administrative boundaries. These neighborhoods may reflect the way people in an area identify themselves or they might reflect how others, such as real estate developers, have defined those areas. Well-known non-administrative neighborhoods include the historic and trendy LoDo (short for “Lower Downtown”), part of the city’s Union Station neighborhood; Uptown, straddling North Capitol Hill and City Park West; Curtis Park, part of the Five Points neighborhood; Alamo Placita, the northern part of the Speer neighborhood; Park Hill, a successful example of intentional racial integration; and Golden Triangle, in the Civic Center.
City streets
Most of Denver has a straightforward street grid oriented to the four cardinal directions. Blocks are usually identified in hundreds from the median streets, identified as “00”, which are Broadway (the east–west median, running north–south) and Ellsworth Avenue (the north–south median, running east–west). Colfax Avenue, a major east–west artery through Denver, is 15 blocks (1500) north of the median. Avenues north of Ellsworth are numbered (with the exception of Colfax Avenue and several others, such as Martin Luther King, Jr. Blvd and Montview Blvd.), while avenues south of Ellsworth are named.
There is also an older downtown grid system that was designed to be parallel to the confluence of the South Platte River and Cherry Creek. Most of the streets downtown and in LoDo run northeast–southwest and northwest–southeast. This system has an unplanned benefit for snow removal; if the streets were in a normal N–S/E–W grid, only the N–S streets would receive sunlight. With the grid oriented to the diagonal directions, the NW–SE streets receive sunlight to melt snow in the morning and the NE–SW streets receive it in the afternoon. This idea was from Henry Brown the founder of the Brown Palace Hotel. There is now a plaque across the street from the Brown Palace Hotel that honors this idea. The NW–SE streets are numbered, while the NE–SW streets are named. The named streets start at the intersection of Colfax Avenue and Broadway with the block-long Cheyenne Place. The numbered streets start underneath the Colfax and I-25 viaducts. There are 27 named and 44 numbered streets on this grid. There are also a few vestiges of the old grid system in the normal grid, such as Park Avenue, Morrison Road, and Speer Boulevard. Larimer Street, named after William Larimer, Jr., the founder of Denver, which is in the heart of LoDo, is the oldest street in Denver.
All roads in the downtown grid system are streets (e.g. 16th Street, Stout Street). Roads outside that system that travel east/west are given the suffix “avenue” and those that head north and south are given the “street” suffix (e.g. Colfax Avenue, Lincoln Street). Boulevards are higher capacity streets and travel any direction (more commonly north and south). Smaller roads are sometimes referred to as places, drives (though not all drives are smaller capacity roads, some are major thoroughfares) or courts. Most streets outside the area between Broadway and Colorado Boulevard are organized alphabetically from the city’s center.
Some Denver streets have bicycle lanes, leaving a patchwork of disjointed routes throughout the city. There are over 850 miles of paved, off-road, bike paths in Denver parks and along bodies of water, like Cherry Creek and the South Platte. This allows for a significant portion of Denver’s population to be bicycle commuters and has led to Denver being known as a bicycle-friendly city. Some residents are very opposed to bike lanes, which have caused some plans to be watered down or nixed. The review process for one bike line on Broadway will last over a year before city council members will make a decision. In addition to the many bike paths, Denver launched B-Cycle – a citywide bicycle sharing program – in late April 2010. The B-Cycle network was the largest in the United States at the time of its launch, boasting 400 bicycles.
Free vector maps:

Free download Vector Map US Interstate roads, Adobe PDF, V.2 Free_Map_US_Interstates_Roads_2.pdf
Free download Vector Map US Interstate roads, Adobe Illustrator, V.2 Free_Map_US_Interstates_Roads_2.ai
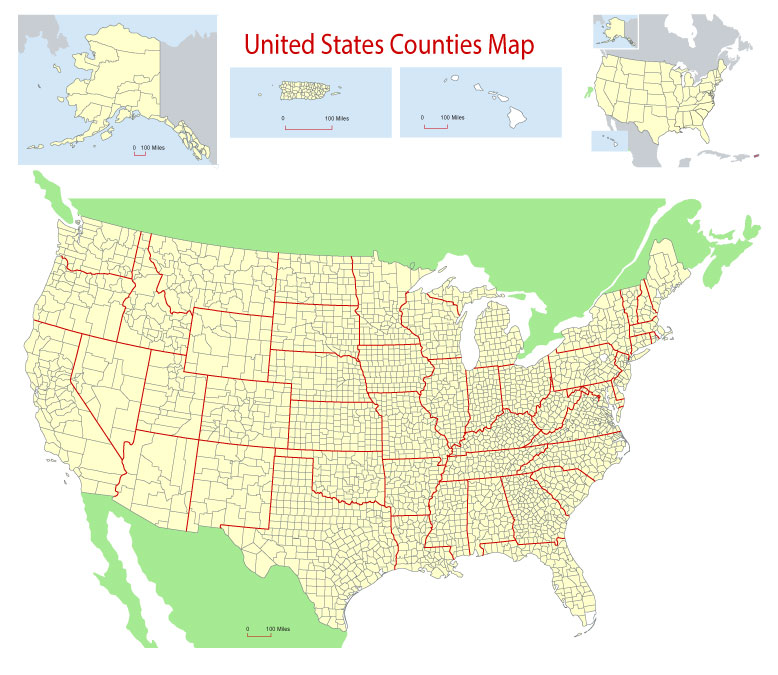
Free Download Vector Map US County and State Adobe Illustrator
Free_Vector_Map_US_States_County_Map.ai
Free Download Vector Map US County and State Adobe PDF
Free_Vector_Map_US_States_County_Map.pdf
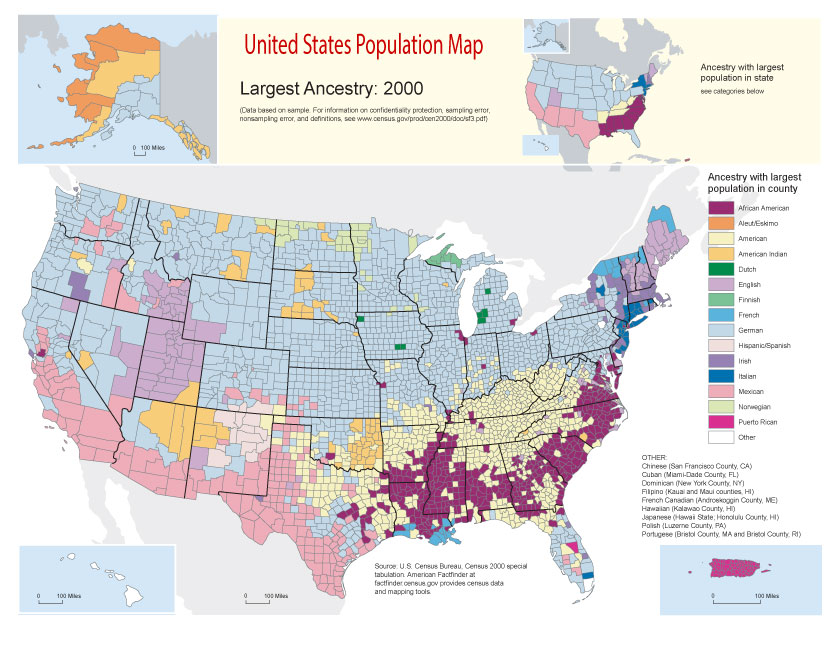
Free Vector Map US Census Data Top US Ancestries by County Adobe Illustrator
Free_Vector_Map_US_Census-Data-Top-US-Ancestries-by-County.ai
Free Vector Map US Census Data Top US Ancestries by County Adobe PDF
Free_Vector_Map_US_Census-Data-Top-US-Ancestries-by-County.pdf
Small guide: How to work with the vector map?
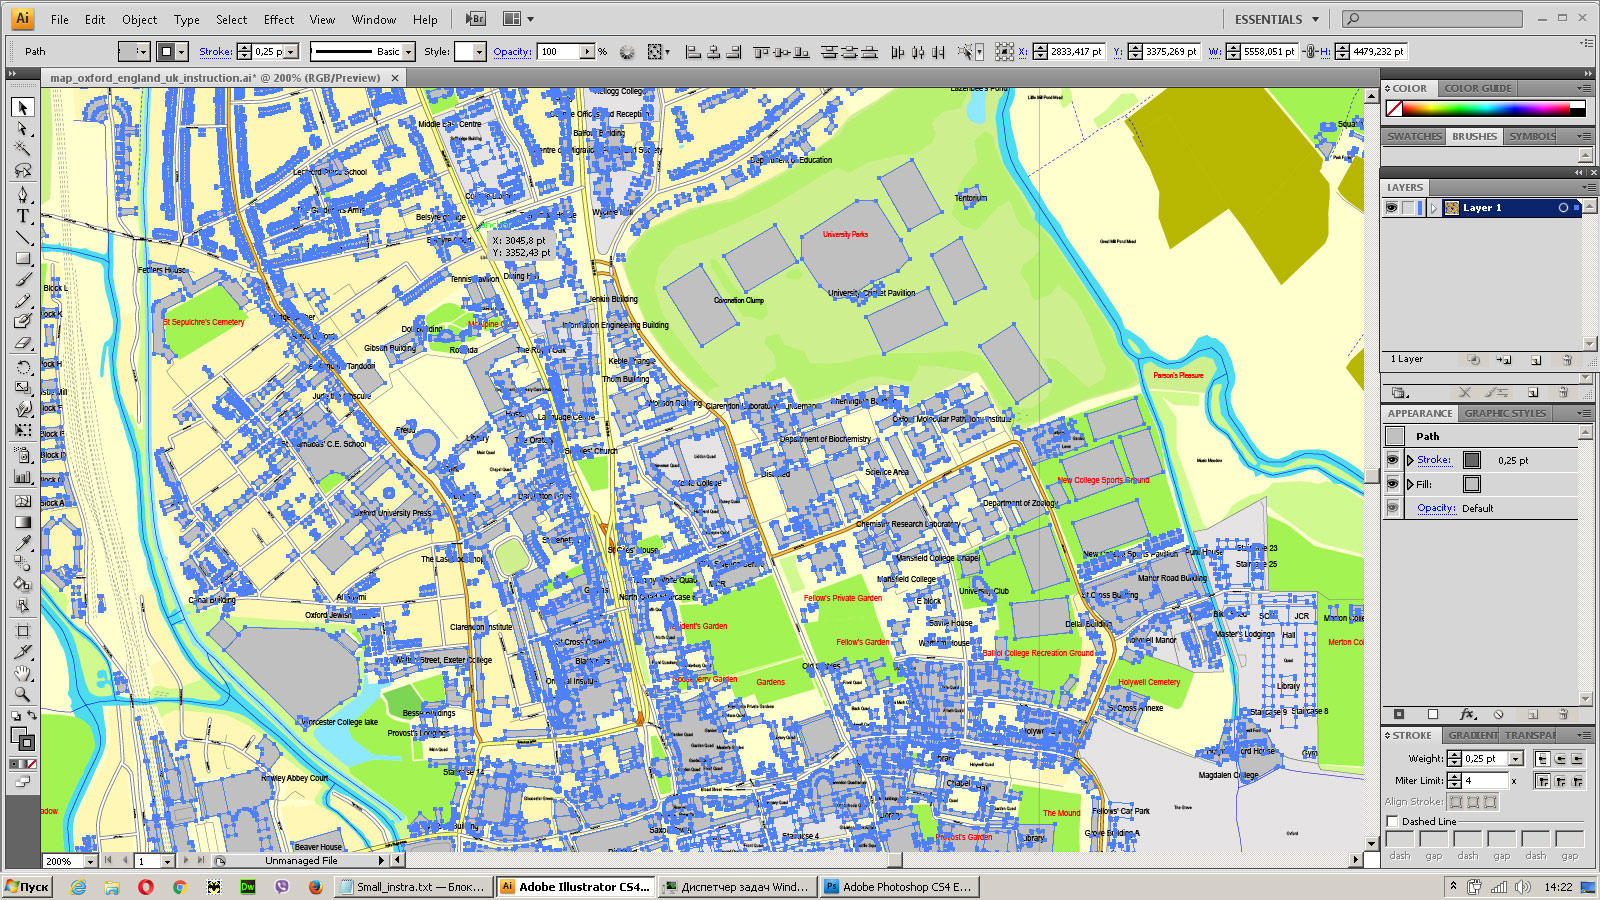
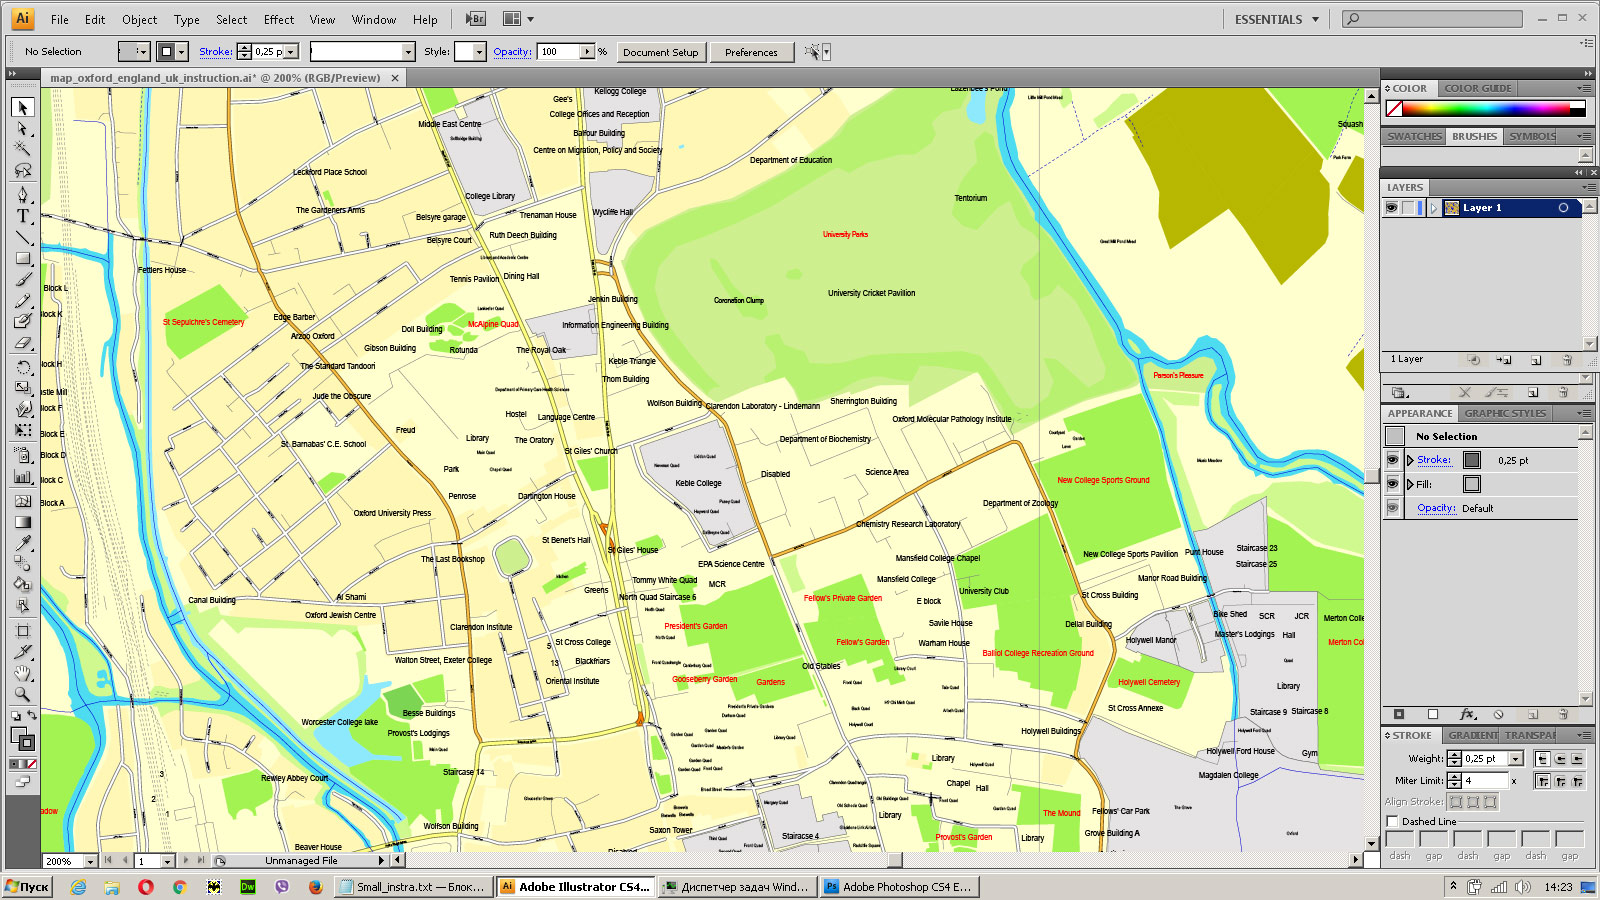
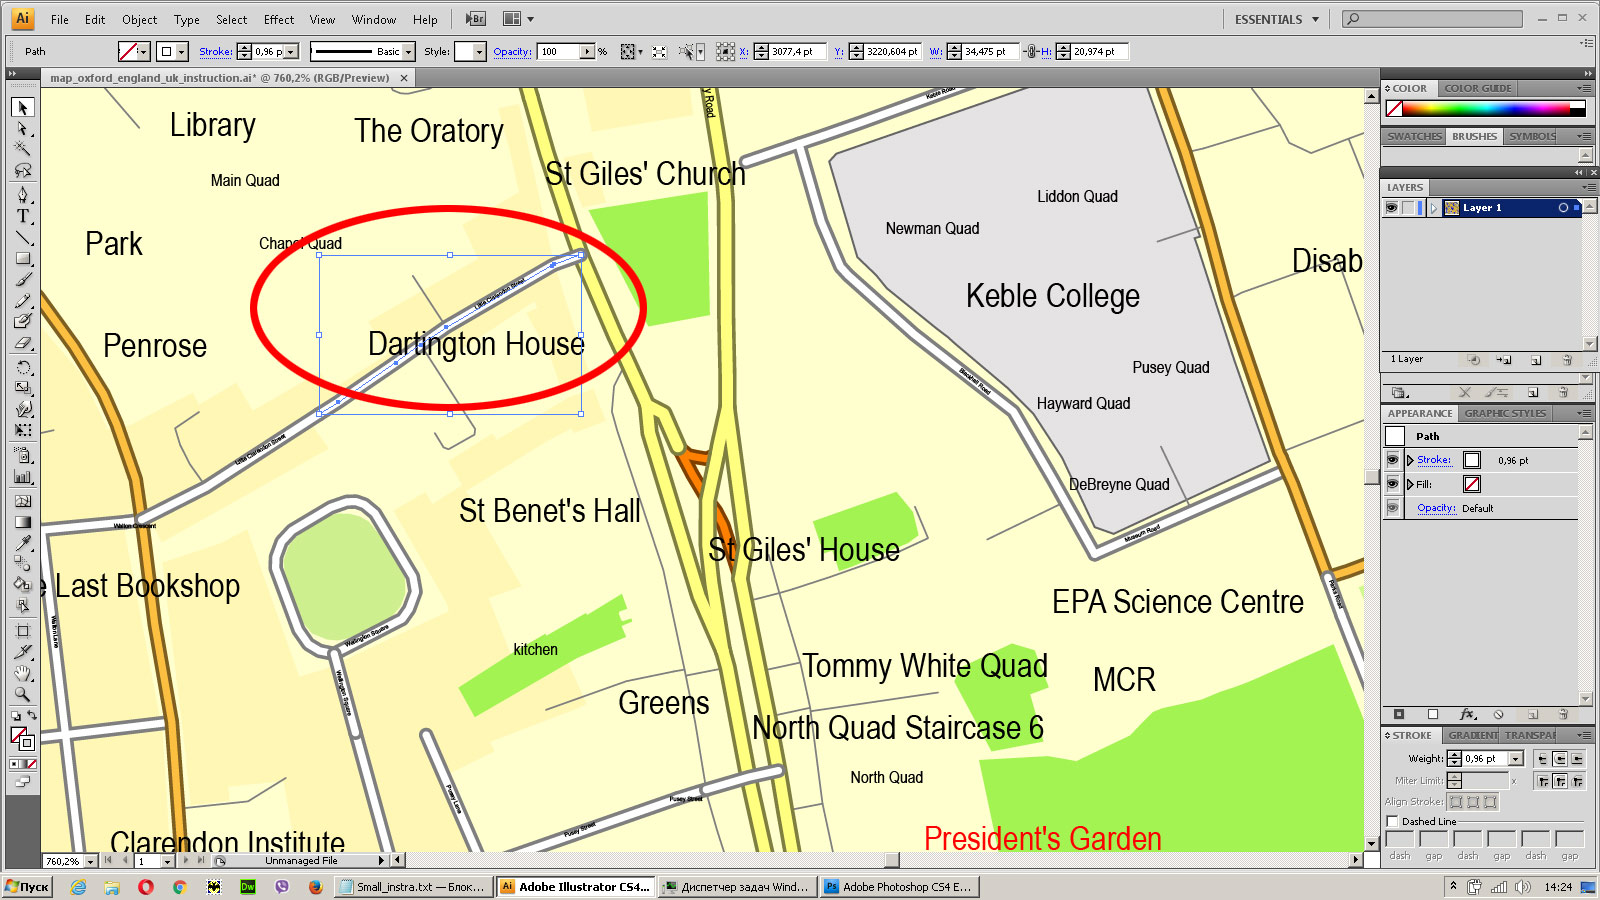
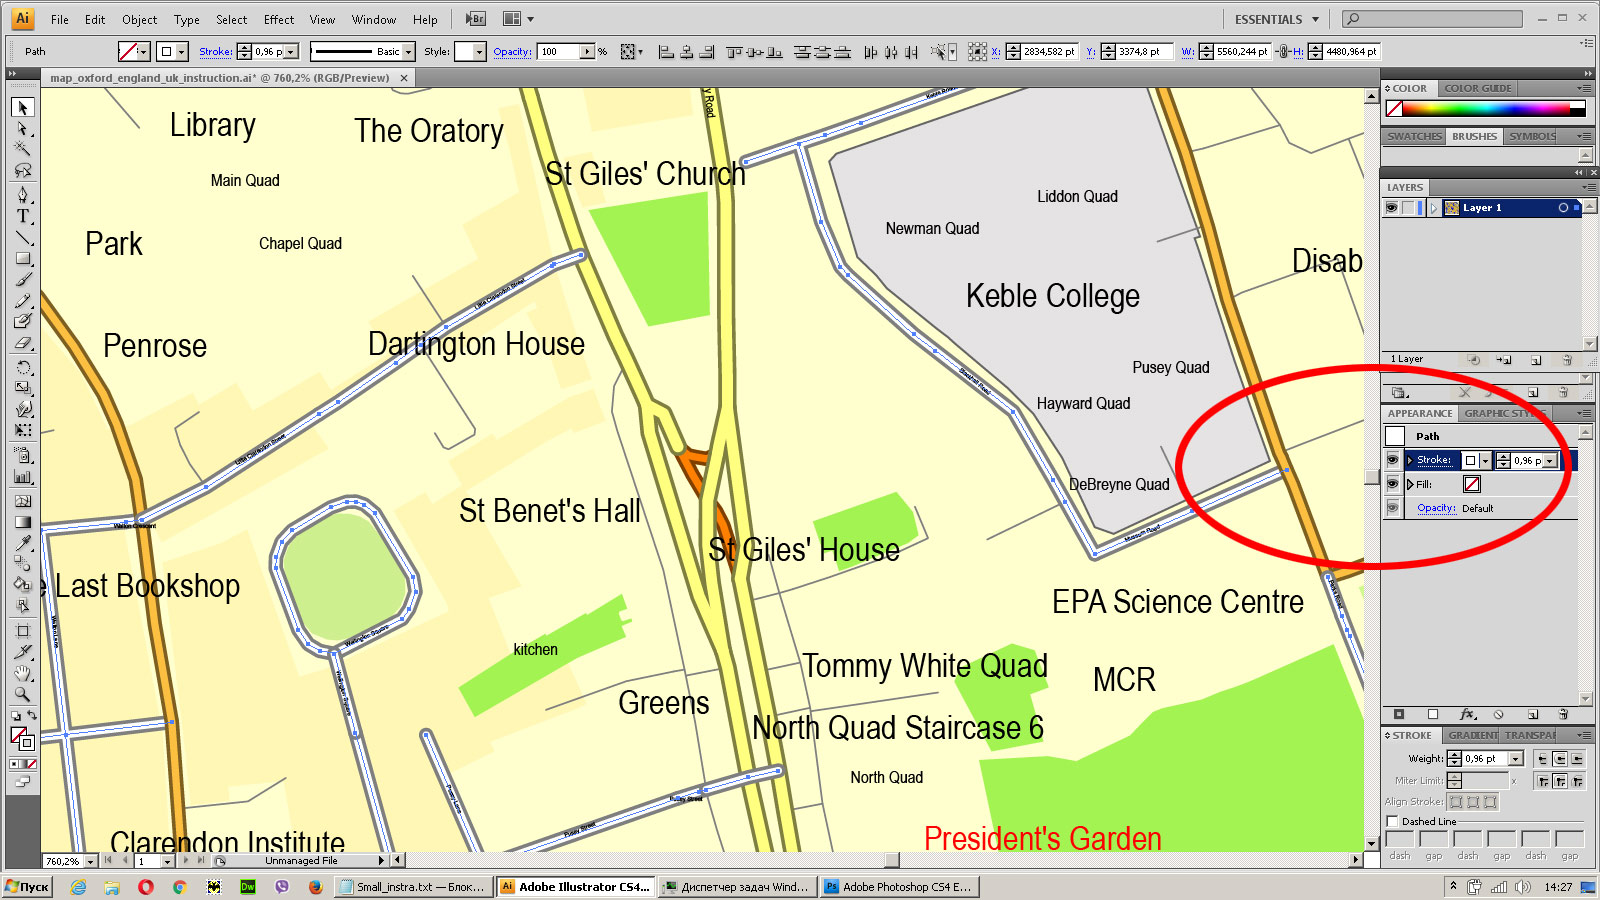
You can: Mass select objects by type and color – for example, the objects type “building” (they are usually dark gray) – and remove them from the map, if you do not need them in your print or design project. You can also easily change the thickness of lines (streets), just bulk selection the road by the line color.
The streets are separated by type, for example, type “residential road” are usually white with a gray stroke. Highway usually orange with a brown or dark gray stroke.
It is easy to change the font of inscriptions, all or each individually. Also, just can be make and any other manipulation of objects on the vector map in Adobe illustrator format.
Important: All the proportions on the map are true, that is, the relative sizes of the objects are true, because Map is based on an accurate GPS projection, and It transated into the (usual for all) the Mercator projection.
You can easily change the color, stroke and fill of any object on the map, zoom without loss of quality Image Verification.
Select object
Bulk selection the same objects on the vector map
See the bulk selected objects on the vector map
Bulk delete buildungs from the vector map
Select residencial road (small street) on the vector map
Bulk selection the same lines (streets, roads) on the full map
Create fat lines of the streets on the vector maps (bulk action) 1
Create fat lines of the streets on the vector maps (bulk action) 2

Create fat lines of the streets on the vector maps (bulk action) 3
You can easily change the color, stroke and fill of any object on the map, zoom without loss of quality Image Verification.
Denver, Colorado
Denver, officially the City and County of Denver, is the capital and most populous municipality of the U.S. state of Colorado. Denver is located in the South Platte River Valley on the western edge of the High Plains just east of the Front Range of the Rocky Mountains. The Denver downtown district is located immediately east of the confluence of Cherry Creek with the South Platte River, approximately 12 mi (19 km) east of the foothills of the Rocky Mountains. Denver is nicknamed the Mile-High City because its official elevation is exactly one mile (5,280 ft or 1,610 m) above sea level, making it one of the highest major cities in the United States. The 105th meridian west of Greenwich, the longitudinal reference for the Mountain Time Zone, passes directly through Denver Union Station.
Denver is ranked as a Beta- world city by the Globalization and World Cities Research Network. With a 2015 estimated population of 682,545, Denver ranks as the 19th-most populous U.S. city, and with a 2.8% increase in 2015, the city is also the fastest growing major city in the United States. The 10-county Denver-Aurora-Lakewood, CO Metropolitan Statistical Area had an estimated 2015 population of 2,814,330 and ranked as the 19th most populous U.S. metropolitan statistical area. The 12-city Denver-Aurora, CO Combined Statistical Area had an estimated 2015 population of 3,418,876, which ranks as the 16th most populous U.S. metropolitan area. Denver is the most populous city of the 18-county Front Range Urban Corridor, an oblong urban region stretching across two states with an estimated 2015 population of 4,757,713. Denver is the most populous city within a 500-mile (800 km) radius in the Mountain West and the second-most populous city in the Southwestern United States after Phoenix, Arizona. In 2016, Denver was named the best place to live in the USA by U.S. News & World Report.
Geography of Denver, Colorado
Denver is located in the center of the Front Range Urban Corridor, between the Rocky Mountains to the west and the High Plains to the east. Denver’s topography consists of plains in the city center with hilly areas to the north, west and south. According to the United States Census Bureau the city has a total area of 155 square miles (401 km2), of which 153 square miles (396 km2) is land and 1.6 square miles (4.1 km2) (1.1%) is water. The City and County of Denver is surrounded by only three other counties: Adams County to the north and east, Arapahoe County to the south and east, and Jefferson County to the west.
Although Denver‘s nickname is the “Mile-High City” because its official elevation is one mile above sea level, defined by the elevation of the spot of a benchmark on the steps of the State Capitol building, the elevation of the entire city ranges from 5,130 to 5,690 feet (1,560 to 1,730 m). According to Geographic Names Information System (GNIS) and the National Elevation Dataset, the city’s elevation is 5,278 feet (1,609 m), which is reflected on various websites such as that of the National Weather Service.
Neighborhoods
Downtown Denver
As of January 2013, the City and County of Denver has defined 78 official neighborhoods that the city and community groups use for planning and administration.[51] Although the city’s delineation of the neighborhood boundaries is somewhat arbitrary, it corresponds roughly to the definitions used by residents. These “neighborhoods” should not be confused with cities or suburbs, which may be separate entities within the metro area.
The character of the neighborhoods varies significantly from one to another and includes everything from large skyscrapers to houses from the late 19th century to modern, suburban style developments. Generally, the neighborhoods closest to the city center are denser, older and contain more brick building material. Many neighborhoods away from the city center were developed after World War II, and are built with more modern materials and style. Some of the neighborhoods even farther from the city center, or recently redeveloped parcels anywhere in the city have either very suburban characteristics or are new urbanist developments that attempt to recreate the feel of older neighborhoods. Most neighborhoods contain parks or other features that are the focal point for the neighborhood.
Denver does not have larger area designations, unlike the City of Chicago, which has larger areas that house the neighborhoods (IE: Northwest Side). Denver residents use the terms “north” “south” “east” and “west”.
Construction along Cherokee Street in the Golden Triangle neighborhood.
Denver also has a number of neighborhoods not reflected in the administrative boundaries. These neighborhoods may reflect the way people in an area identify themselves or they might reflect how others, such as real estate developers, have defined those areas. Well-known non-administrative neighborhoods include the historic and trendy LoDo (short for “Lower Downtown”), part of the city’s Union Station neighborhood; Uptown, straddling North Capitol Hill and City Park West; Curtis Park, part of the Five Points neighborhood; Alamo Placita, the northern part of the Speer neighborhood; Park Hill, a successful example of intentional racial integration; and Golden Triangle, in the Civic Center.
https://en.wikipedia.org/wiki/Denver#Geography

 Author: Kirill Shrayber, Ph.D. FRGS
 editable Adobe Illustrator in layers")


