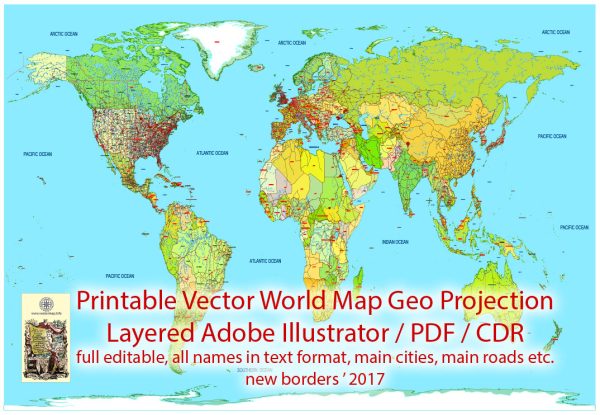
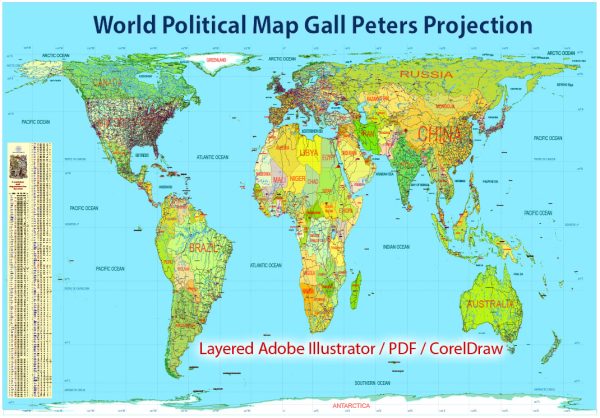
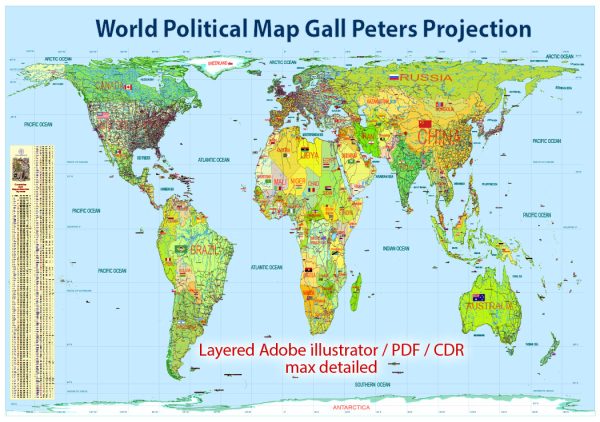
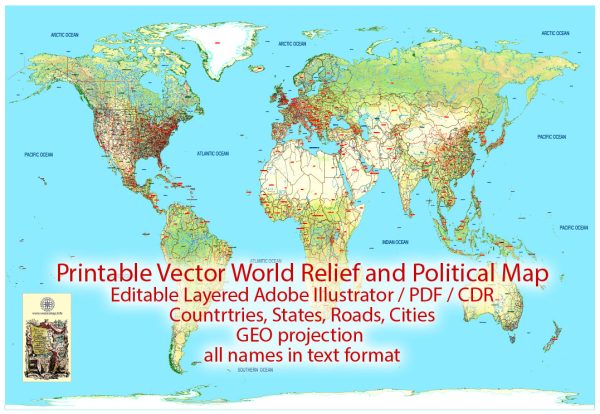
The choice of map projection is an important decision in cartography because it determines how the Earth’s three-dimensional surface is represented on a two-dimensional map. Different map projections are used to emphasize different aspects of the Earth’s geography, and each has its strengths and weaknesses. Here are a few examples of different map projections:
- Mercator Projection:
- Strength: Preserves angles and shapes, making it useful for navigation.
- Weakness: Distorts the size of objects as you move toward the poles, making polar regions look much larger than they are.
- Robinson Projection:
- Strength: A compromise projection that tries to minimize distortions in size, shape, and distance.
- Weakness: Does not excel in any particular aspect but offers a good balance.
- Winkel Tripel Projection:
- Strength: A compromise projection that provides a more accurate representation of size and shape than the Robinson projection.
- Weakness: Still some distortion at high latitudes.
- Mollweide Projection:
- Strength: Preserves area, making it useful for showing the relative sizes of countries and continents.
- Weakness: Distorts shapes, especially near the edges.
- Eckert IV Projection:
- Strength: A pseudocylindrical projection that balances size and shape.
- Weakness: Distortion increases at the poles.
- Goode’s Homolosine Projection:
- Strength: Minimizes area distortion and is often used for thematic maps.
- Weakness: Complicated shape, which makes it less useful for navigation.
- Azimuthal Equidistant Projection:
- Strength: Preserves accurate distances and directions from a central point.
- Weakness: Distortion increases as you move away from the central point.
- Sinusoidal Projection:
- Strength: Good for showing distributions and for equal-area mapping.
- Weakness: Distorts shape and angles.
- Conic Projection:
- Strength: Useful for mapping specific regions with a conical shape.
- Weakness: Distorts areas outside the region of focus.
- Polyconic Projection:
- Strength: Designed for mapping smaller areas with minimal distortion.
- Weakness: Not suitable for mapping the entire world.
These are just a few examples of the many map projections that cartographers use to represent the Earth’s surface. The choice of projection depends on the specific purpose of the map and the trade-offs between different types of distortion. Different projections excel in different aspects, and cartographers choose the one that best suits their needs.

 Author: Kirill Shrayber, Ph.D. FRGS