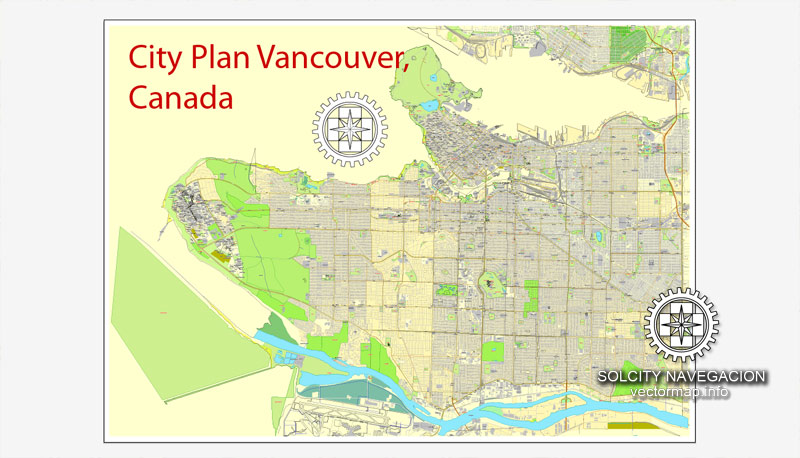
Vancouver map: Printable City Plan Map of Vancouver, Canada, Adobe Illustrator, full vector, scalable, editable, separated text layer street names, 23,5 mb ZIP
All streets, all buildings. Map for design, print, arts, projects, presentations,
for architects, designers and builders.
CDR, DWG, DXF and other formats – on demand, same price, please, contact
Vancouver, Canada.
This is the most detailed, exact map of Vancouver city for high-quality printing and polygraphy. You can always clarify the map development date by contacting us.
For your convenience, all objects on Vancouver vector city map are divided into layers, and the editing is very easy – colors, lines, etc.
Use these commands if you need to edit the colors in the selected vector map of Vancouver city.
«Repaint Graphic object» button on the «Control» panel.
Use this button if you need to adjust colors of Vancouver city vector map using the а «Repaint graphic object» dialog box.
Vancouver is a coastal seaport city in western Canada, located in the Lower Mainland region of British Columbia. As the most populous city in the province, the 2016 census recorded 631,486 people in the city, up from 603,502 in 2011. The Greater Vancouver area had a population of 2,463,431 in 2016, making it the third-largest metropolitan area in Canada. Vancouver has the highest population density in Canada with over 5,400 people per square kilometre, which makes it the fifth-most densely populated city with over 250,000 residents in North America behind New York City, Guadalajara, San Francisco, and Mexico City according to the 2011 census. Vancouver is one of the most ethnically and linguistically diverse cities in Canada according to that census; 52% of its residents have a first language other than English. Roughly 30% of the city’s inhabitants are of Chinese heritage. Vancouver is classed as a Beta global city.
One of the advantages of Vancouver city vector maps of our production is the relevance of cartographic data, we constantly update all our products.
This vector map of Vancouver city is used by:
designers, layout designers, printers, advertisers and architects. Our product – vector maps – is designed for further editing and printing in large formats – from @Wall format (a few meters) to A-0 and A-1, A-2, A-3.
This vector map of Vancouver city is used as a basis for design, editing, and further printing.
The specified button is available if the selected vector map or its fragment contains two or more colors.
Note. This color editing method is convenient for global color adjustment in a vector map, if global colors were not used when creating a City Map of Vancouver.
The «Edit colors» button or «Edit or apply colors» on the «Color Catalog» palette
Click this button if you need to edit colors on the «Color Catalog» palette or edit and then apply them to the selected Vector Map of Vancouver city or its fragment.
You can easily add any objects needed (e.g. shops, salons, sale points, gas station or attraction) on any layer of Vancouver vector map.
The Greater Vancouver area had a population of 2,463,431 in 2016, making it the third-largest metropolitan area in Canada.
Take a look, who purchases our vector maps of Vancouver city in “Our Clients and Friends” page – these are large and small companies, from super-brands like Volvo and Starbucks, to small design studios and printing houses.
Vancouver, a bustling west coast seaport in British Columbia, is among Canada’s densest, most ethnically diverse cities. A popular filming location, it’s surrounded by mountains, and also has thriving art, theatre and music scenes. Vancouver Art Gallery is known for its works by regional artists, while the Museum of Anthropology houses preeminent First Nations collections.
Area
• City 114.97 km2 (44.39 sq mi)
• Metro 2,878.52 km2 (1,111.40 sq mi)
Elevation 0–152 m (0–501 ft)
Population
• City 631,486 (8th)
• Density 5,492.6/km2 (14,226/sq mi)
• Urban 2,264,823
• Metro 2,463,431 (3rd)
Vancouver is a coastal seaport city in western Canada, located in the Lower Mainland region of British Columbia. As the most populous city in the province, the 2016 census recorded 631,486 people in the city, up from 603,502 in 2011.
It’s very easy to work with vector maps of Vancouver city, even for a not very experienced designer who can turn on and off the map layers, add new objects, change the colors of fill and lines according to customer requirements.
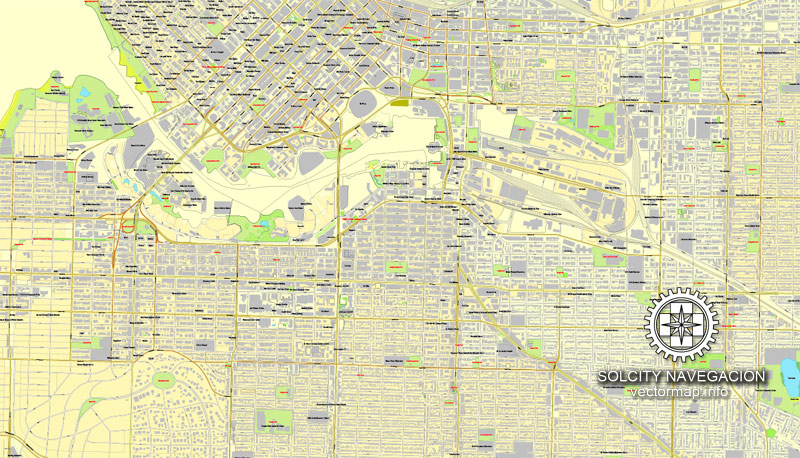
The undoubted advantage of Vancouver city vector maps in printing is an excellent and detailed visualization, when customer can expand a large paper map and instantly define his location, find a landmark, an object or address on map, unlike using the popular electronic formats of Google and Yandex maps for example.
Vancouver has the highest population density in Canada with over 5,400 people per square kilometre, which makes it the fifth-most densely populated city with over 250,000 residents in North America behind New York City, Guadalajara, San Francisco, and Mexico City according to the 2011 census.
Vancouver is one of the most ethnically and linguistically diverse cities in Canada according to that census; 52% of its residents have a first language other than English.
Printable vector maps of Vancouver city is much more convenient and efficient than any electronic maps on your smartphone, because ALL DETAILS are displayed in the entire space of Vancouver city map.
Useful tips on working with vector maps of cities and countries in Adobe Illustrator.
«V» – launches the Selection tool (cursor, black arrow), which makes active any vector line.
«А» – launches the Direct Selection tool (white cursor), allows you to select curve elements and drag them to the desired place.
«R» – activates the Rotate tool, which helps you rotating selected objects around the center point by 360 degrees.
«E» – gives you the opportunity to use the Eraser tool and erase unnecessary parts.
«X» – switches between Fill and Stroke in the Tools section. Try to get used to this hot key and
you will quickly understand that you can’t live and work without it.
Roughly 30% of the city’s inhabitants are of Chinese heritage. Vancouver is classed as a Beta global city.
The Vancouver city map in vector format is used for design, urban planning, presentations and media visualizations.
The advertising and presentation map of Vancouver city (usually the final designer marks the routes, and puts the client’s objects (shops, saloons, gas stations etc.)
The undoubted advantage is that people will NEVER throw out this advertising product – the map. In fact, as an advertising medium, a city map is the most “long-playing” of the well-known polygraphic advertising media, with the longest lifespan, and the maximum number of interactions with the customer.
For travelers, maps are sold at the airports and gas stations around the world. Often the source is our vector maps.
Vancouver is consistently named as one of the top five worldwide cities for livability and quality of life, and the Economist Intelligence Unit acknowledged it as the first city ranked among the top-ten of the world’s most well-living cities for five consecutive years.
The main areas of the dialog box are:
«Edit»
The «Edit» tab is designed to create a new or edit the existing color groups.
The harmony rules Menu and the Color Wheel are used to conduct experiments with color harmonies. The color wheel shows how colors are related in color harmony, and the color bars allow you to view and manipulate an individual color values. In addition, you can adjust the brightness, add and remove colors, save color groups and view colors on the selected Vector Map of Vancouver city or a separated layers.
Assign
The «Assign» tab is used to view and control on how the original colors are replaced with colors from the color group like your corporate colors in the Vector Map of Vancouver city.
The assign color ability is provided only if the entire map, layer or fragment is selected in the document. You can specify which of new colors replace the current colors, whether the spot colors should be preserved and how colors are replaced (for example, you can replace colors completely or changing the color tone while maintaining the brightness). The «Assign» tab allows you to redefine colors in the Vector Map of Vancouver city, or in separate layers and fragments using the current color group or reducing the number of colors in the current Vector Map.
You will probably want to change the color scheme used on our Vancouver vector city map.
To quickly and effectively play with colors.
Of course, you can do it manually, all objects in our Vancouver city vector map are divided according to types and layers, and you can easily change the color gamma of vector objects in groups and layers.
But there is more effective way of working with the whole VECTOR MAP of Vancouver city and all layers:
The overview dialog «Edit colors»/«Repaint Graphic Object» (this dialog box name can change depending on the context):
If you have selected a part or a layer of Vancouver city vector map and open the dialog box by clicking the icon in the Control panel, on the Samples palette or the Color Catalog, or if you choose Edit > Edit Colors> Repaint Graphic Object, then the «Repaint Graphic Object» dialog box appears, and you get access to «Assign» and «Edit» tabs.
Vancouver has hosted many international conferences and events, including the 1954 British Empire and Commonwealth Games, UN Habitat I, Expo 86, the World Police and Fire Games in 1989 and 2009; and the 2010 Winter Olympics and Paralympics which were held in Vancouver and Whistler, a resort community 125 km (78 mi) north of the city. In 2014, following thirty years in California, the TED conference made Vancouver its indefinite home. Several matches of the 2015 FIFA Women’s World Cup were played in Vancouver, including the final at BC Place.
The original settlement, named Gastown, grew up on clearcuts on the west edge of the Hastings Mill logging sawmill’s property, where a makeshift tavern had been set up on a plank between two stumps and the proprietor, Gassy Jack, persuaded the curious millworkers to build him a tavern, on July 1, 1867. From that first enterprise, other stores and some hotels quickly appeared along the waterfront to the west. Gastown became formally laid out as a registered townsite dubbed Granville, B.I. (“B.I” standing for “Burrard Inlet”). As part of the land and political deal whereby the area of the townsite was made the railhead of the Canadian Pacific Railway (CPR), it was renamed “Vancouver” and incorporated shortly thereafter as a city, in 1886. By 1887, the Canadian Pacific transcontinental railway was extended westward to the city to take advantage of its large natural seaport to the Pacific Ocean, which soon became a vital link in a trade route between the Orient / East Asia, Eastern Canada, and Europe. As of 2014, Port Metro Vancouver is the third-largest port by tonnage in the Americas (recently displacing New York City), 27th in the world, the busiest and largest in Canada, and the most diversified port in North America. While forestry remains its largest industry, Vancouver is well known as an urban centre surrounded by nature, making tourism its second-largest industry.
If a picture or a map fragment is not selected, and you open the dialog box by clicking the icon in the Control panel, on the Samples palette or in the Color Catalog, the «Edit Colors» dialog box appears and you can only access the «Edit» tab.
Regardless of the name at the top of the dialog box, the right-hand side always displays the color group of the current document, as well as two default color groups: Print Color and Grayscale. These color groups can be selected and used any time.
Geography
Located on the Burrard Peninsula, Vancouver lies between Burrard Inlet to the north and the Fraser River to the south. The Strait of Georgia, to the west, is shielded from the Pacific Ocean by Vancouver Island. The city has an area of 114 km2 (44 sq mi), including both flat and hilly ground, and is in the Pacific Time Zone (UTC−8) and the Pacific Maritime Ecozone.
Major film production studios in Vancouver and nearby Burnaby have turned Greater Vancouver and nearby areas into one of the largest film production centres in North America, earning it the nickname “Hollywood North”.
Create and edit color groups of Vancouver city vector map, and also assign colors using the «Edit Colors»/ а «Repaint Graphic Object» dialog box.
A. Creating and editing of a color group on the «Edit» tab
B. Assigning colors on the «Assign» tab
C. Select a group of colors from the «Color groups» list
The option «Repaint a graphic object» in the lower part of the dialog box allows you to preview the colors on a selected layer of Vector map, or a group of elements, and specify whether its colors will be redefined when the dialog box is closed.
Until the city’s naming in 1885, “Vancouver” referred to Vancouver Island, and it remains a common misconception that the city is located on the island. The island and the city are both named after Royal Navy Captain George Vancouver (as is the city of Vancouver, Washington in the United States).
Vancouver has one of the largest urban parks in North America, Stanley Park, which covers 404.9 hectares (1,001 acres). The North Shore Mountains dominate the cityscape, and on a clear day, scenic vistas include the snow-capped volcano Mount Baker in the state of Washington to the southeast, Vancouver Island across the Strait of Georgia to the west and southwest, and Bowen Island to the northwest.
Color groups
Is a list of all saved color groups for current document (the same groups appear in the «Samples» palette). You can edit and delete the existing color groups, as well as creating a new ones using the list of “Color Groups” in the dialog box. All changes appear in the «Samples» palette.
The highlighted color group shows, which color group is currently edited. Any color group can be selected and edited, or used to redefine the colors in the selected vector map of Vancouver city, its fragments or elements.
Saving a color group adds this group to the specified list.
Opening the «Edit Colors»/«Repaint Graphic Object» dialog box.
Open the «Edit Colors»/«Repaint Graphic Object» dialog box using one of the following methods:
«Edit»> «Edit Colors»> «Repaint Graphic object» or «Repaint With Style».
The «Edit color group» button or «Edit or apply color group» on the «Samples» palette.
Click this button if you need to edit the colors in the specific color group or edit and apply them to the selected Vector Map of Vancouver city or a group of its elements, for example, the whole layer “Streets and lines”. You can also double-click the color group in the Samples panel to open the dialog box.
If the map file is too large and your computer freezes or even can’t open it quickly:
1. Try to reduce the color resolution of the video card (display) to 256 colors while working with a large map.
2. Using Windows Task Manager, select all the application you don’t need, while working with map, just turn them off.
3. Launch Adobe Illustrator. (DO NOT OPEN the vector map file)
4. Start the Windows Task Manager using administrator rights > Find the “Illustrator” process > set the «real time» priority,
5. Open the file. When you see the LEGACY FONT popup window – click “OK” (do not update). You can restore the TEXT later.
6. Can also be useful: When file is opened – Edit > Settings > Basic Settings > disable smoothing. /// It looks scary, but works quickly)))
We recommend saving the file in Adobe Illustrator 10 version. It’s much more stable when working with VERY BIG size files.
Guides are not limited to vertical and horizontal in Adobe Illustrator. You can also create a diagonal guide for example. Moreover, you can turn any contours into guides. Select the outline and go to View > Guides > Make Guides (Create Guides), or simply press Cmd/Ctrl + 5. You can also turn the guides back into an editable object. Go to menu, View > Guides > Unlock Guides (Release Guides), select the guide you want to edit and select View > Guides > Release Guides (Reset Guides), or just press Cmd/Ctrl + Option / Alt + 5).
Small guide: How to work with the vector map?
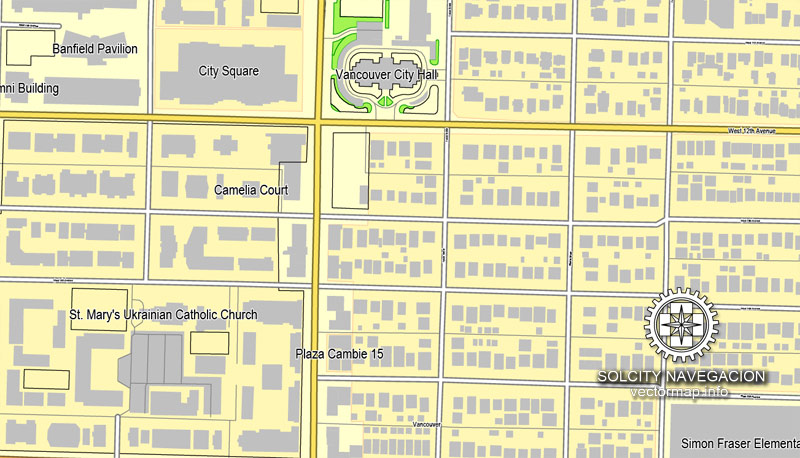
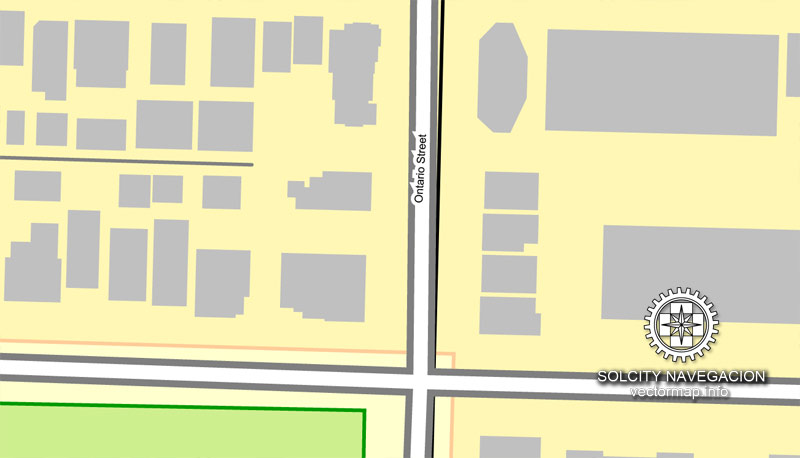
You can: Mass select objects by type and color – for example, the objects type “building” (they are usually dark gray) – and remove them from the map, if you do not need them in your print or design project. You can also easily change the thickness of lines (streets), just bulk selection the road by the line color.
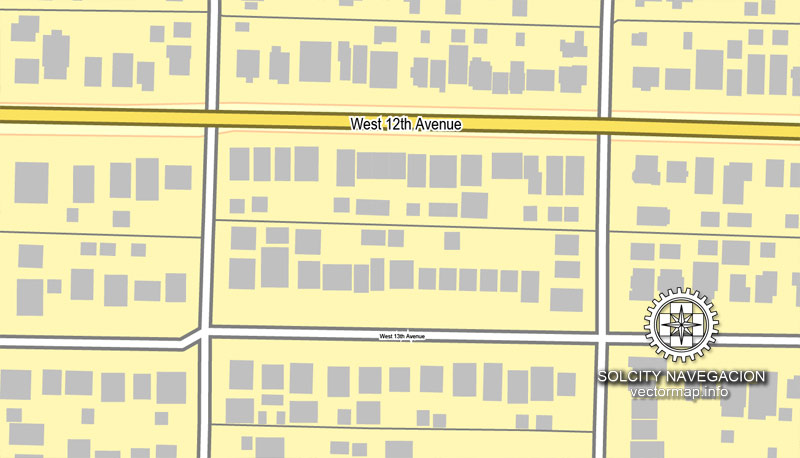
The streets are separated by type, for example, type “residential road” are usually white with a gray stroke. Highway usually orange with a brown or dark gray stroke.
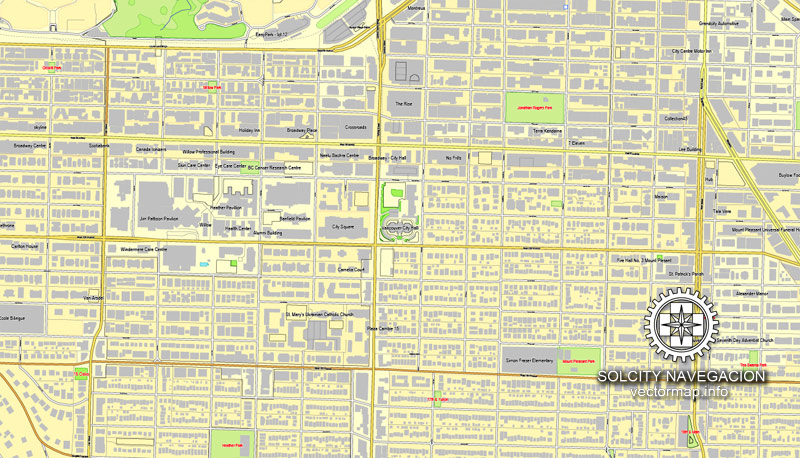
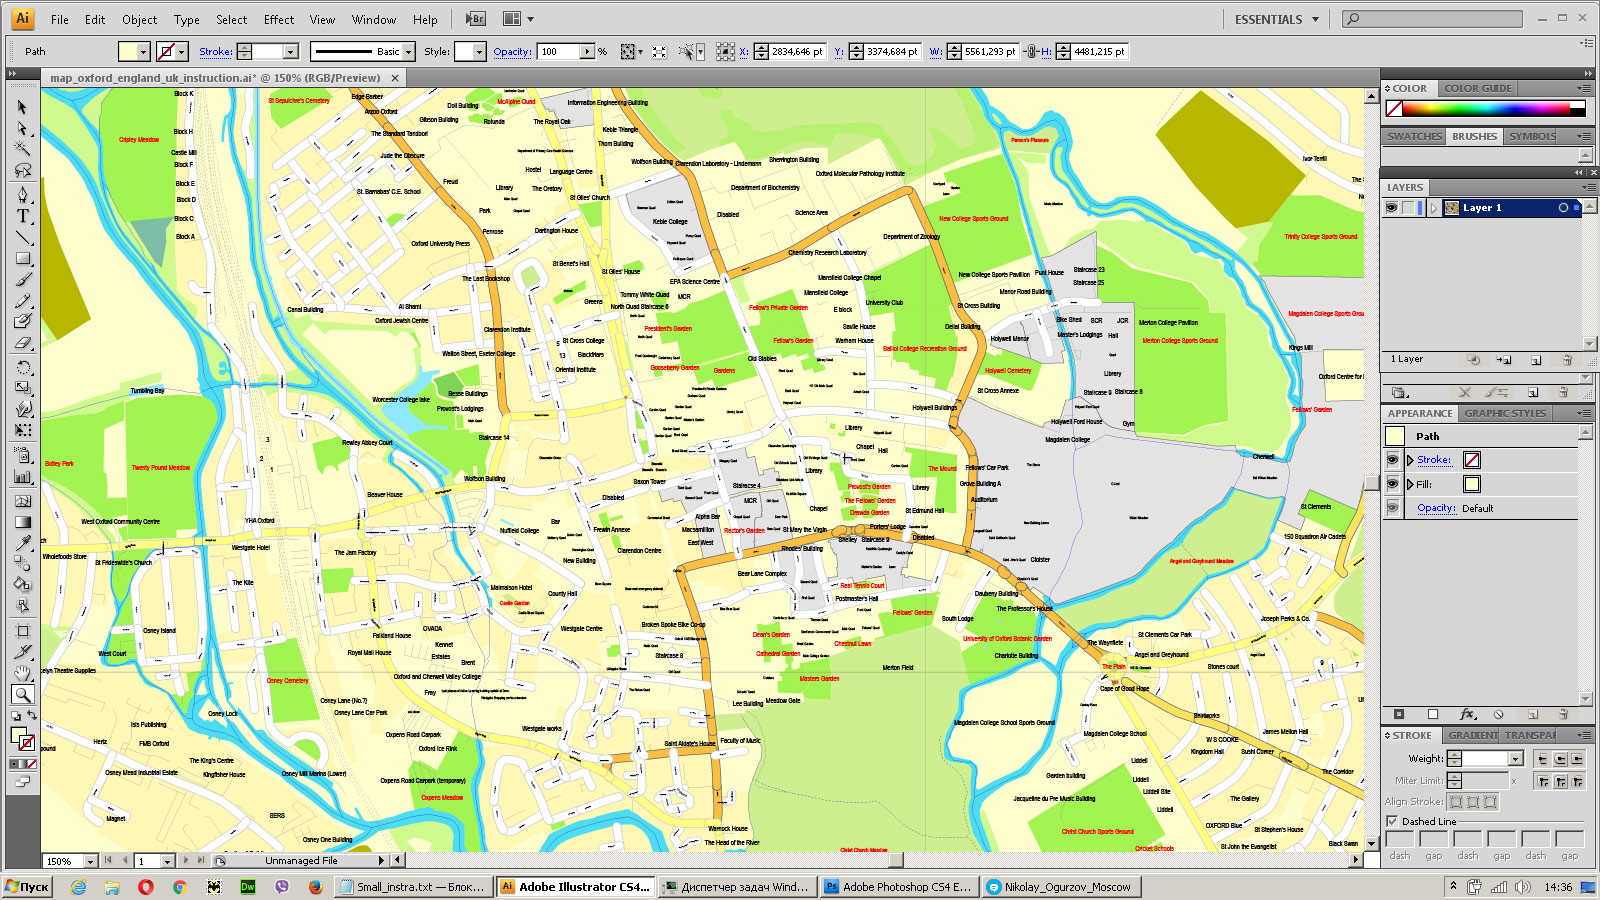
All objects are divided by types: different types of roads and streets, polygons of buildings, landfills, urban areas, parks and more other.
It is easy to change the font of inscriptions, all or each individually. Also, just can be make and any other manipulation of objects on the vector map in Adobe illustrator format.
Important: All the proportions on the map are true, that is, the relative sizes of the objects are true, because Map is based on an accurate GPS projection, and It transated into the (usual for all) the Mercator projection.
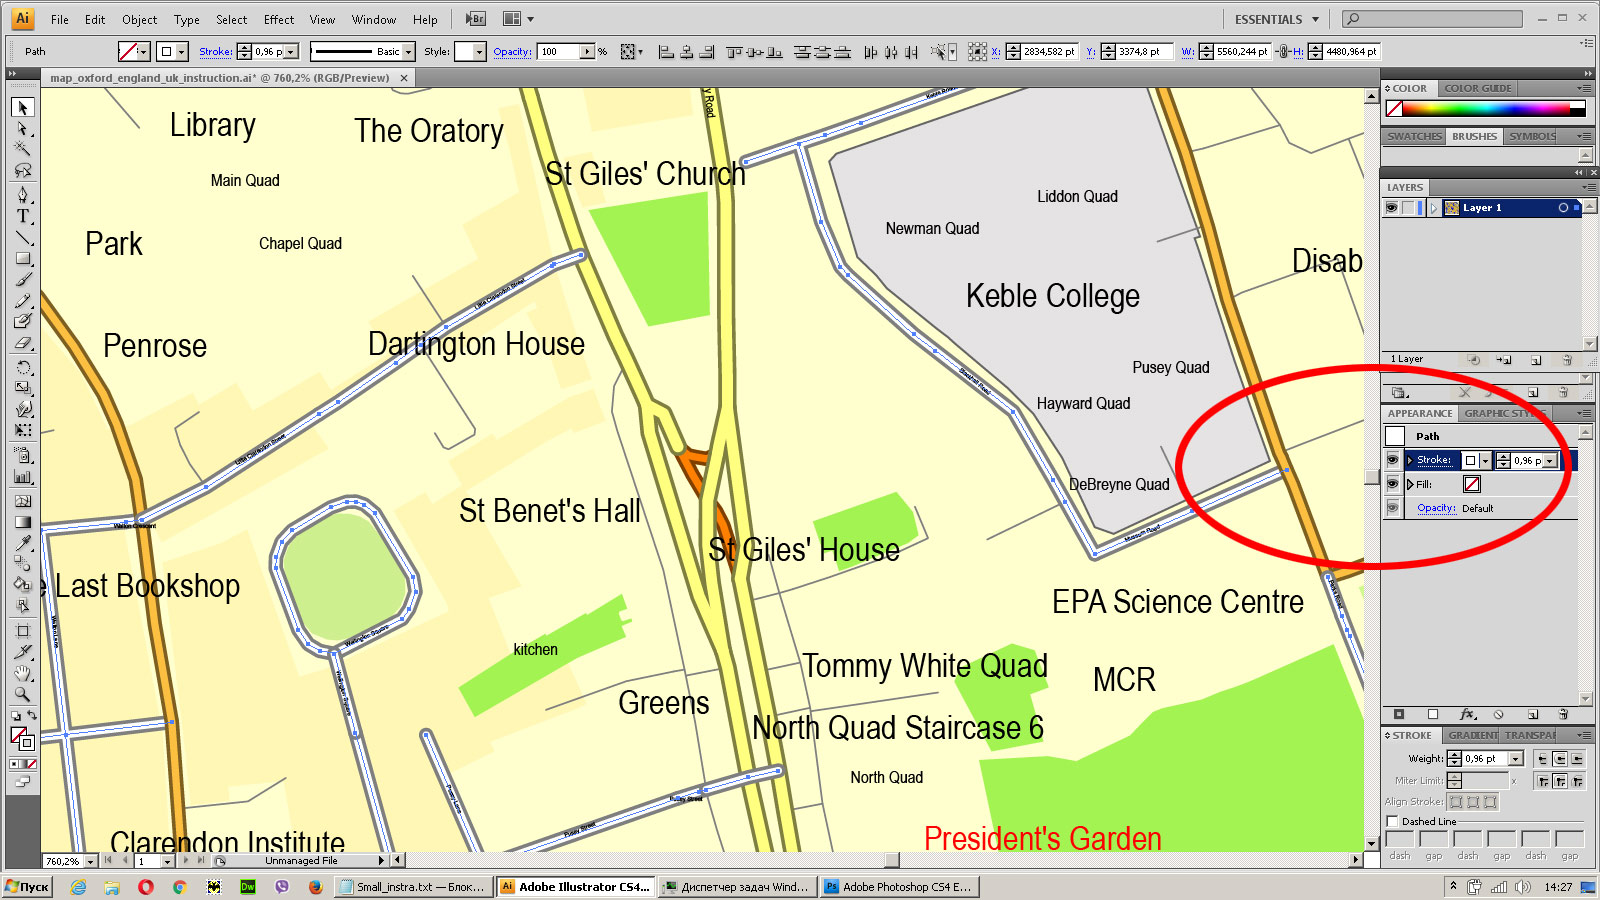
You can easily change the color, stroke and fill of any object on the map, zoom without loss of quality Image Verification.
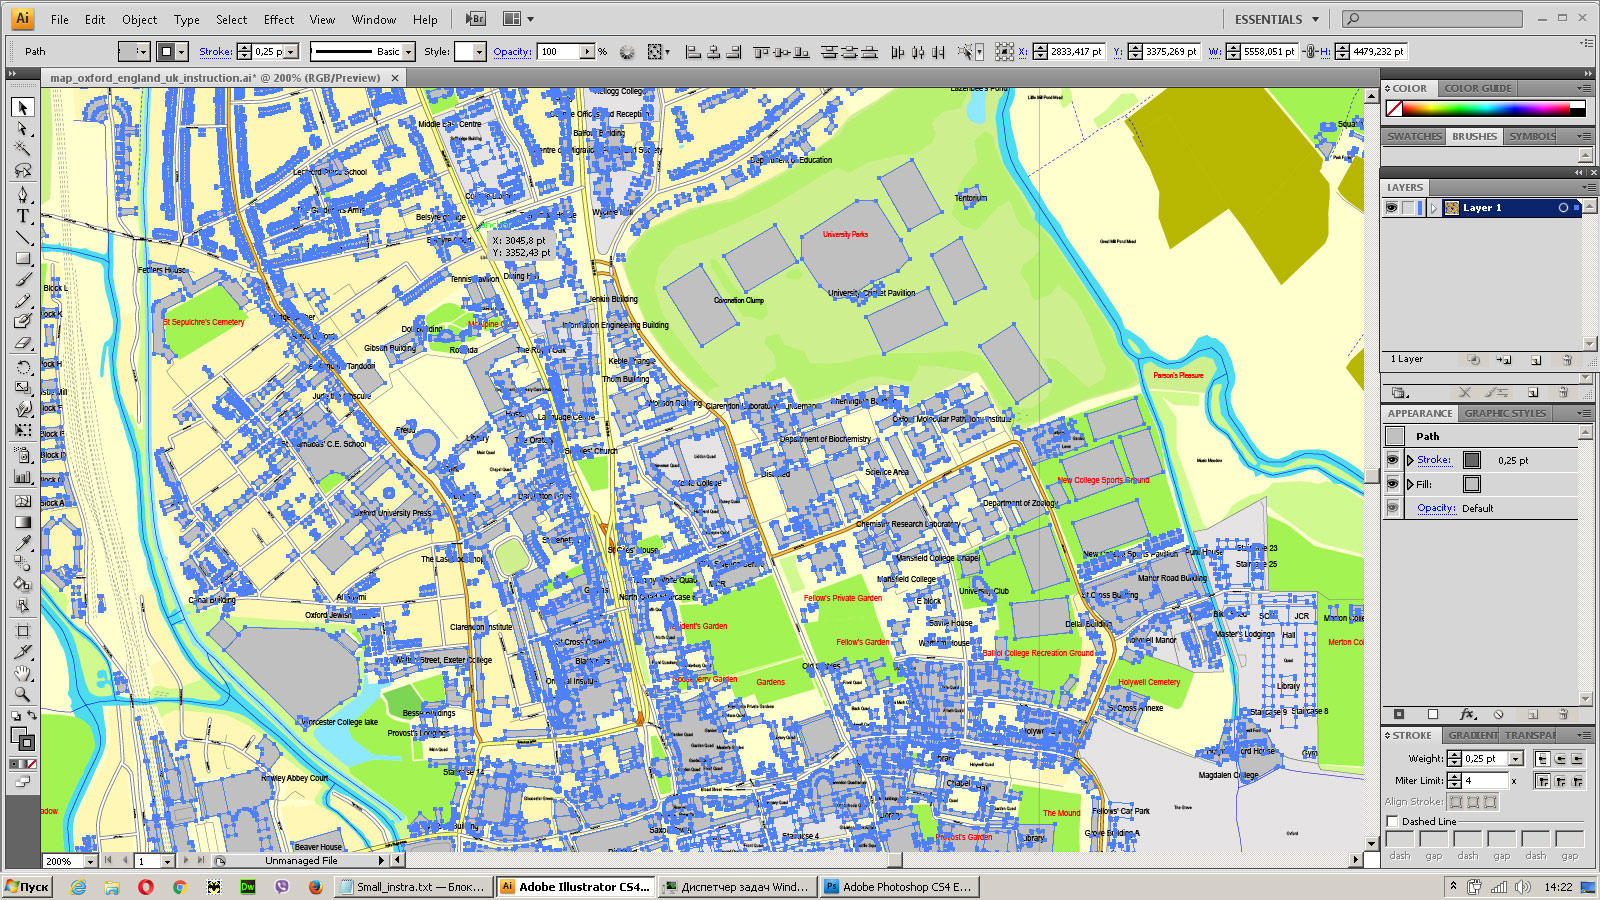
Select object
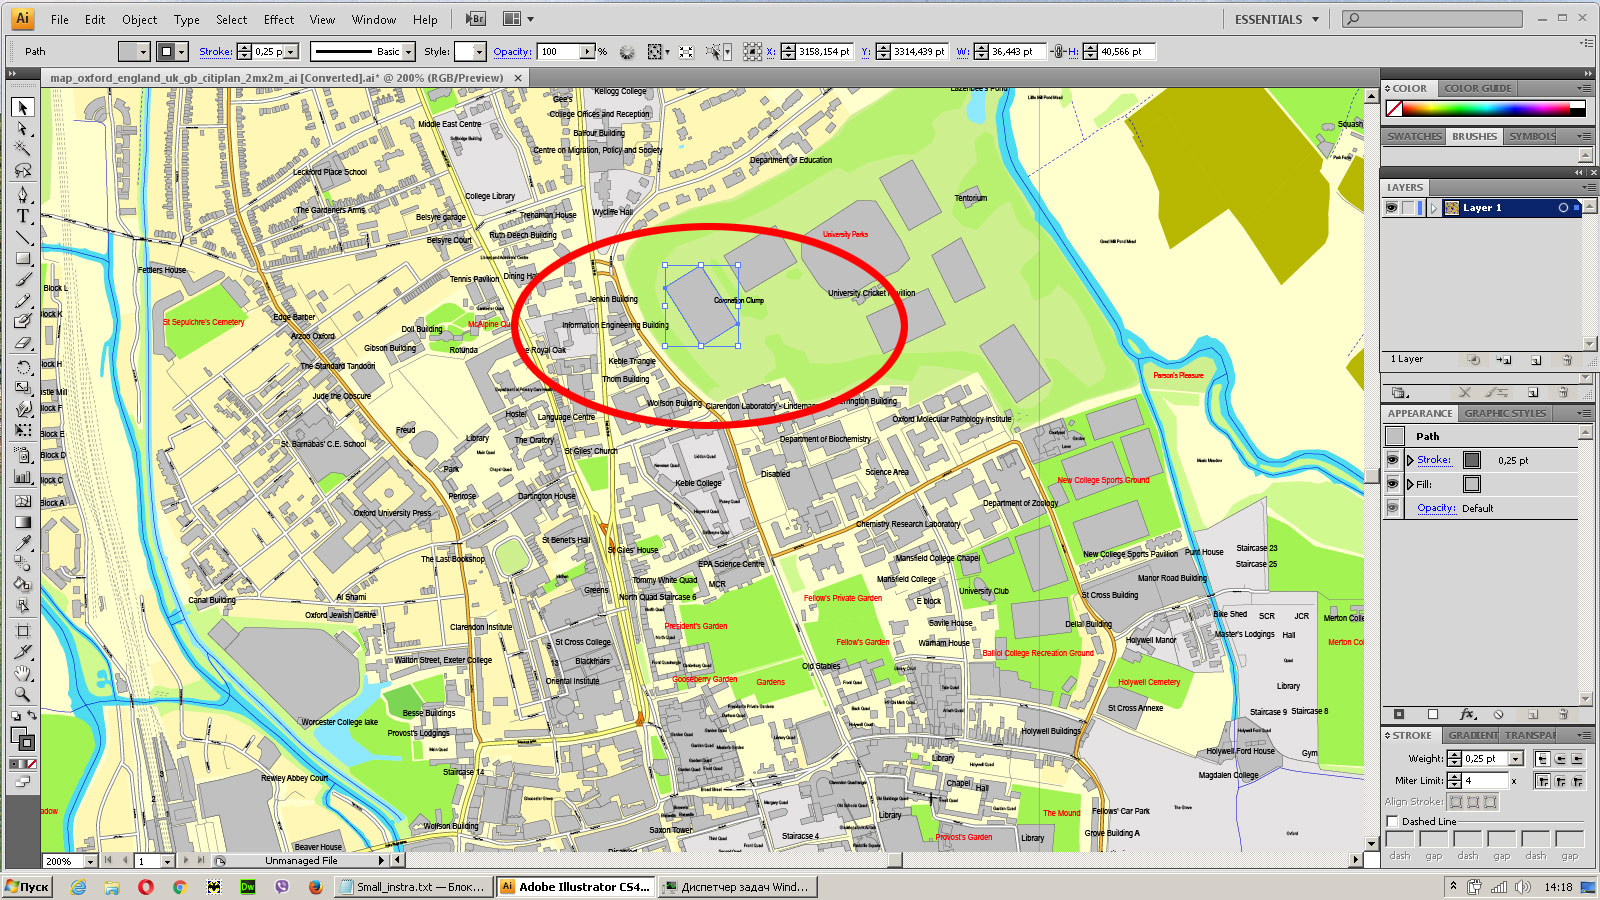
Bulk selection the same objects on the vector map
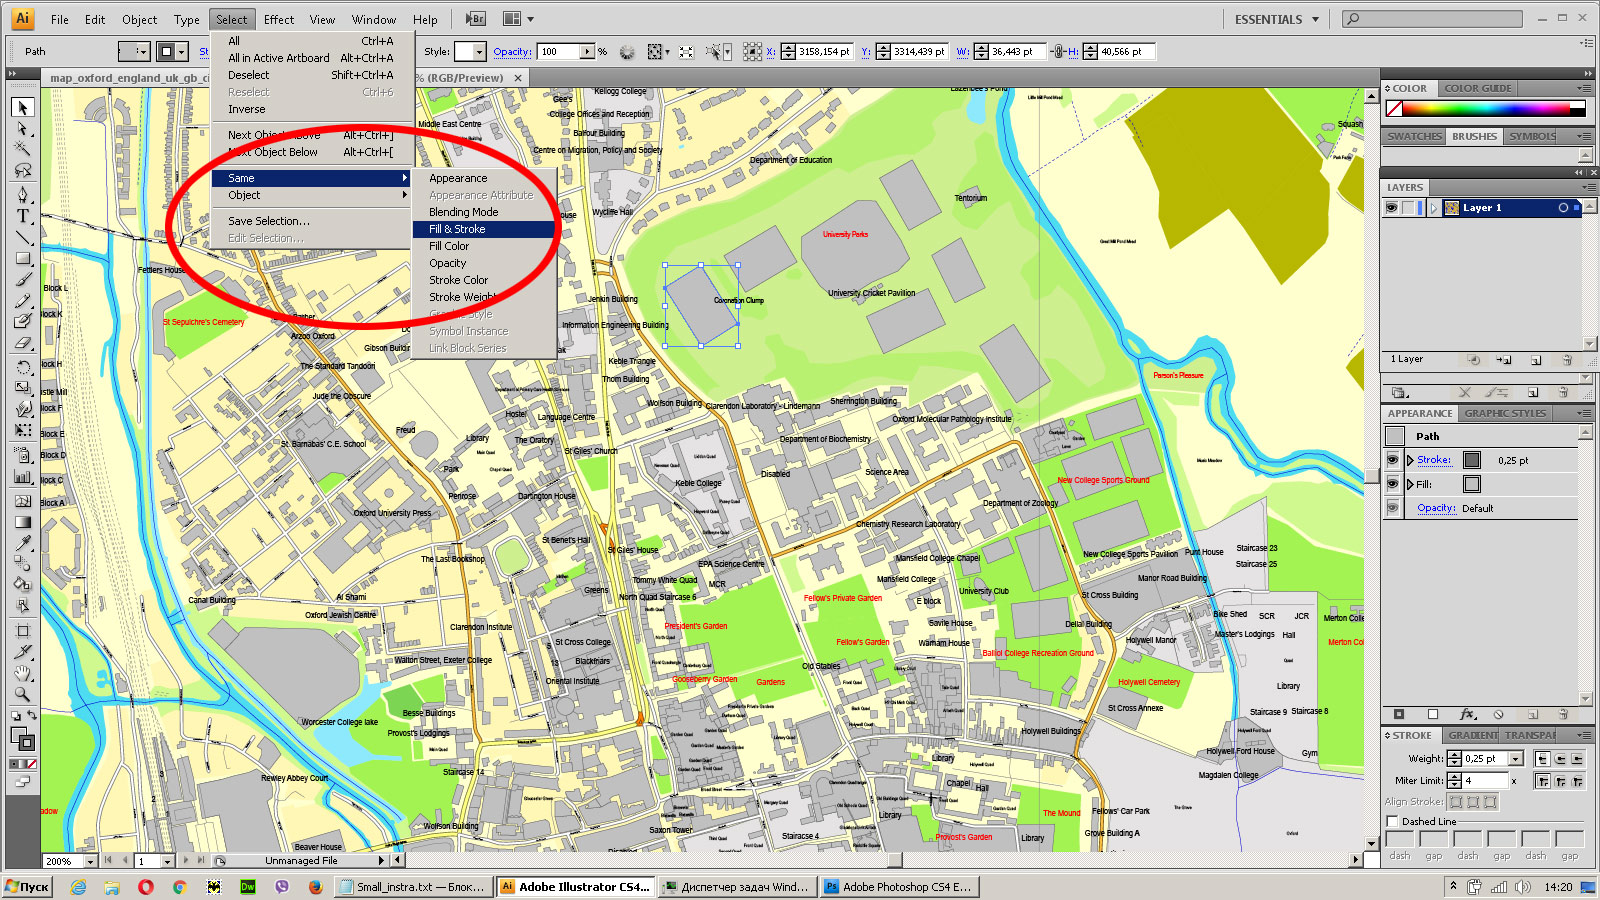
See the bulk selected objects on the vector map
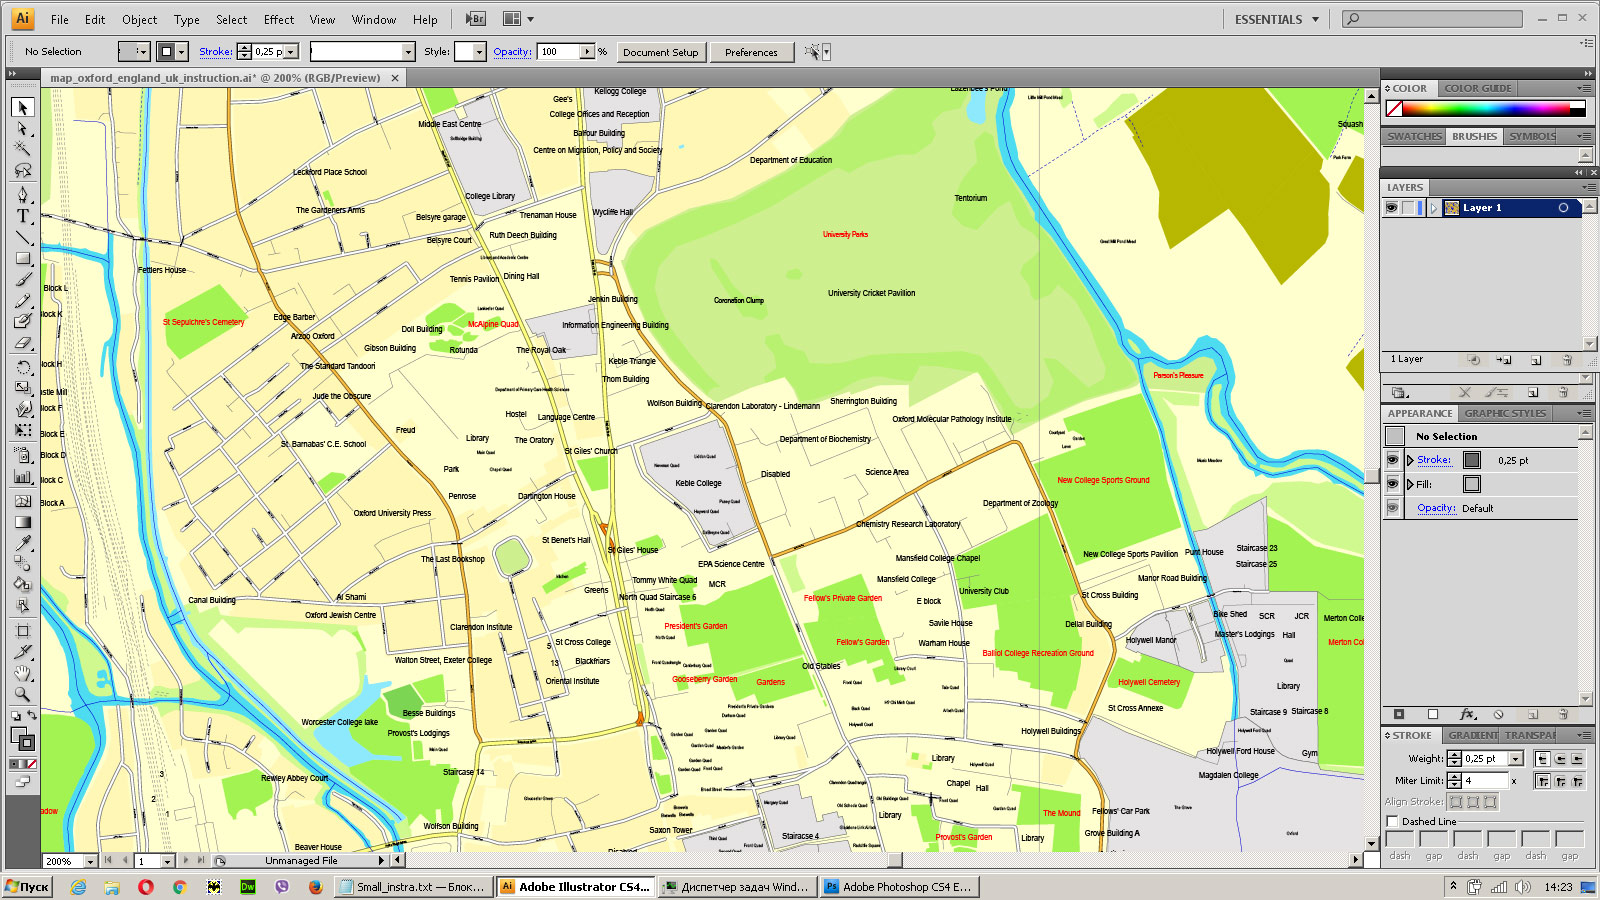
Bulk delete buildungs from the vector map
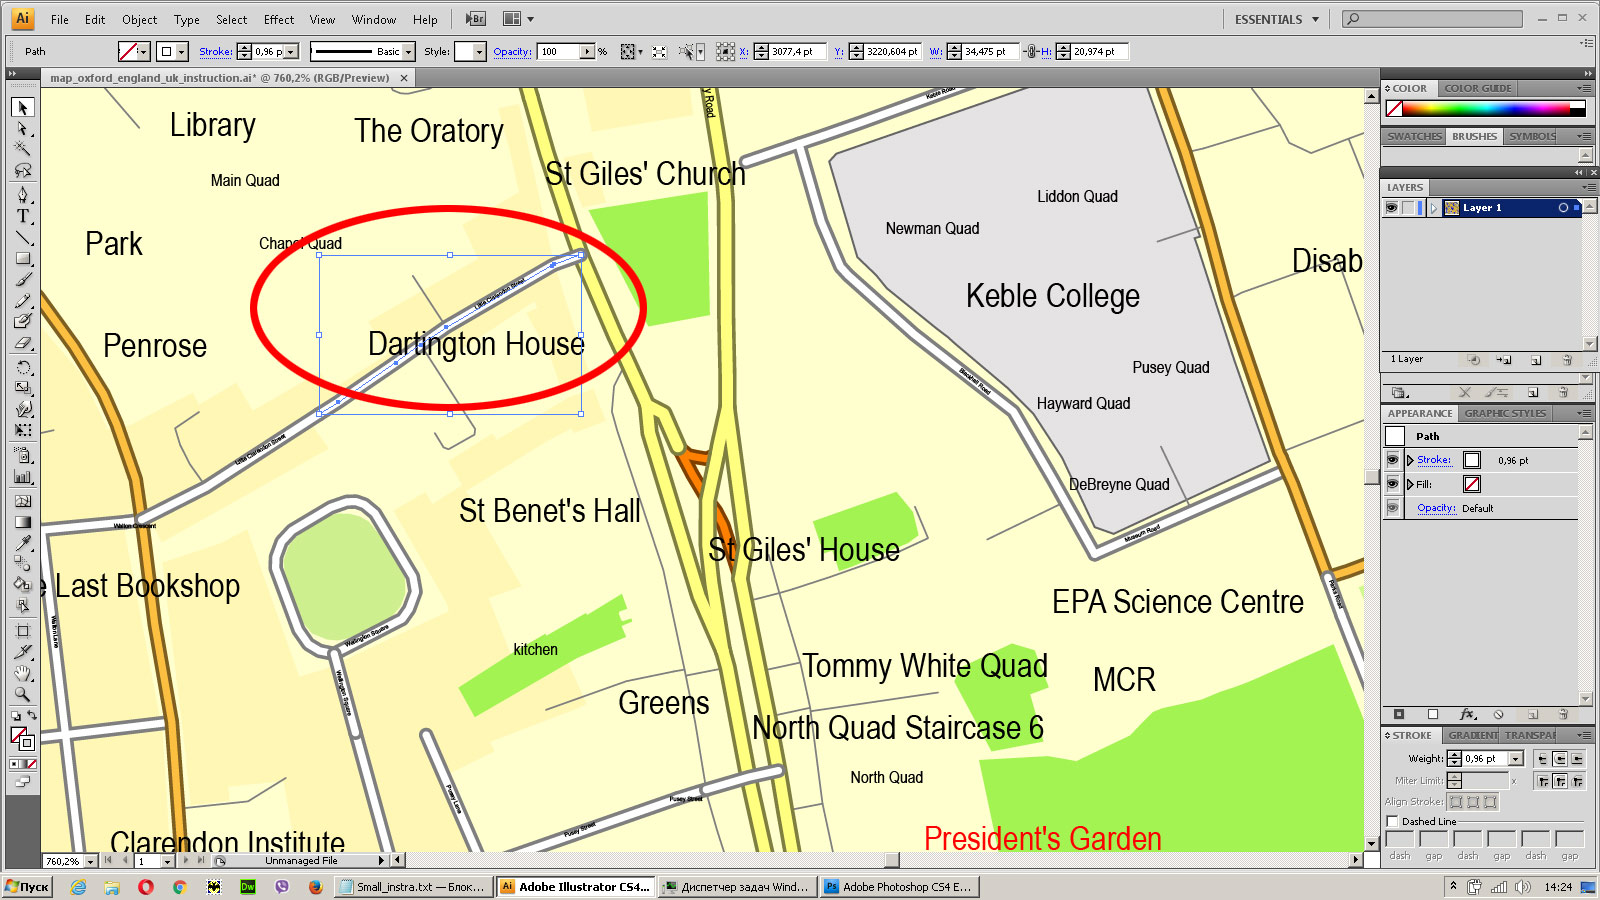
Select residencial road (small street) on the vector map
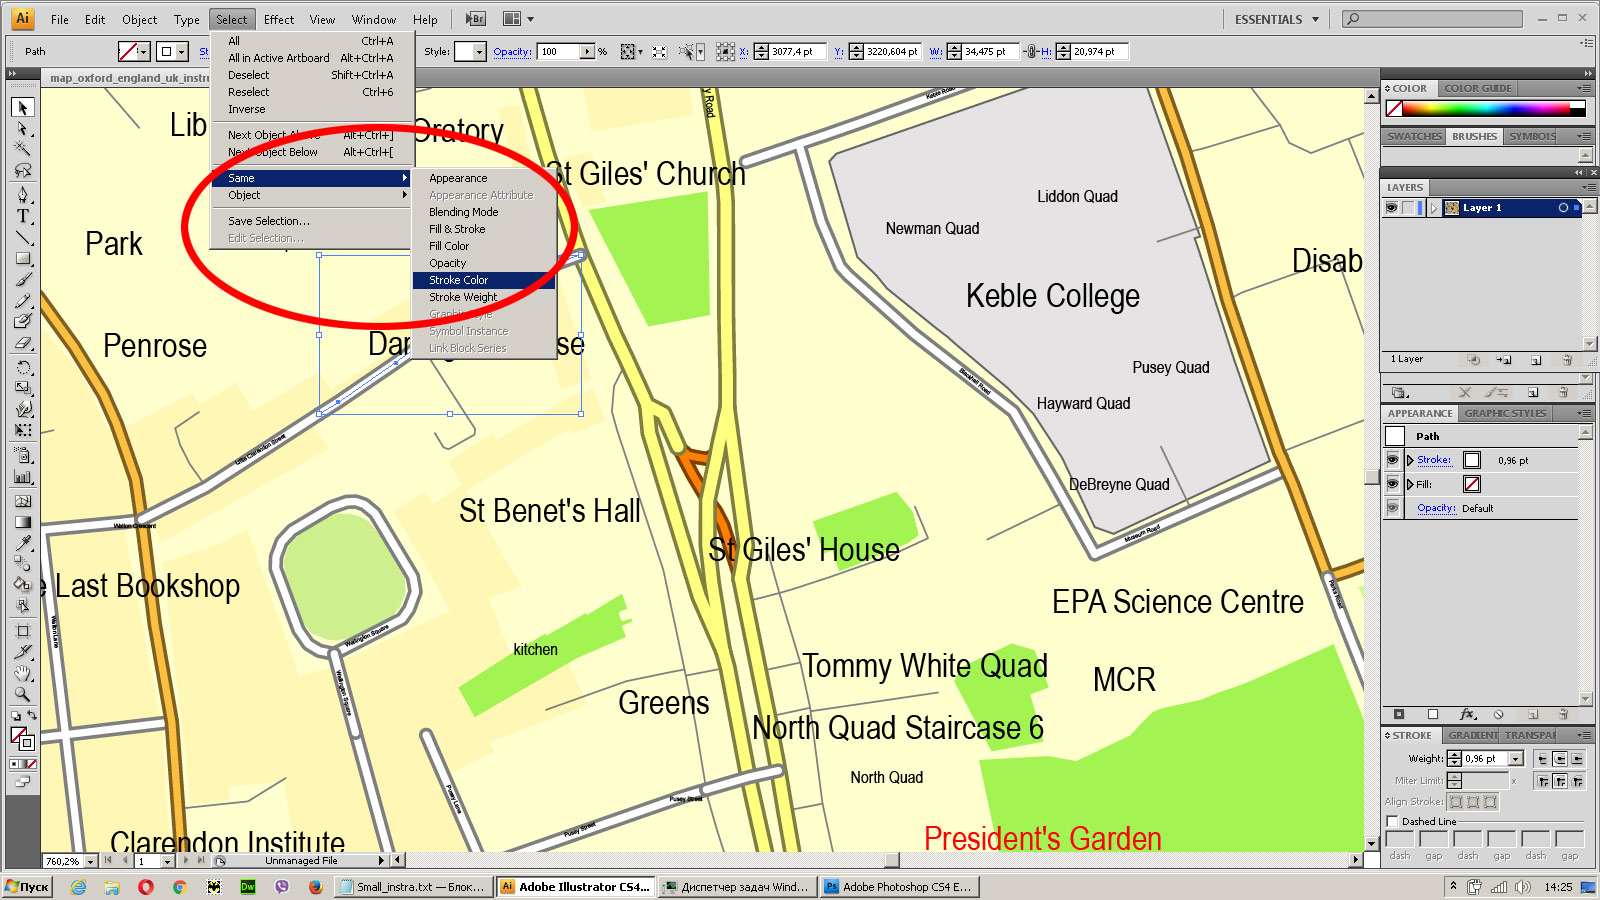
Bulk selection the same lines (streets, roads) on the full map
Create fat lines of the streets on the vector maps (bulk action) 1
Create fat lines of the streets on the vector maps (bulk action) 2

Create fat lines of the streets on the vector maps (bulk action) 3
You can easily change the color, stroke and fill of any object on the map, zoom without loss of quality Image Verification.

 Author: Kirill Shrayber, Ph.D. FRGS
 Street Map editable Adobe Illustrator in layers")
 Street Map editable Adobe Illustrator in layers")
 Street Map editable Adobe Illustrator in layers")