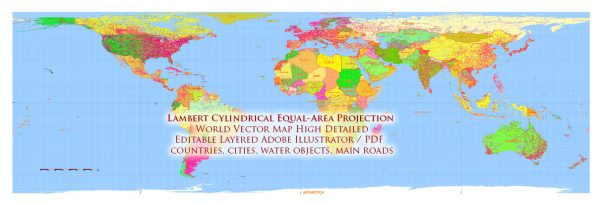
The Lambert projection is a type of map projection that was developed by the French mathematician and physicist Johann Heinrich Lambert in 1772. This projection is used to create maps of the Earth’s surface, particularly for areas that are larger in the east-west direction than in the north-south direction. The Lambert projection is a conic projection, which means it is created by projecting the Earth’s surface onto a cone, and then unrolling that cone onto a flat surface.
Here is a brief history of the creation and development of the Lambert projection:
- Johann Heinrich Lambert (1728-1777): Lambert was a Swiss-German mathematician and physicist who is credited with inventing the Lambert conformal conic projection. He developed this projection as a way to accurately represent the Earth’s surface on maps, especially for areas with significant east-west extent. Lambert’s work on this projection was published in his book “Photometria” in 1772.
- Further Development: Lambert’s work laid the foundation for further development of the Lambert projection. Over time, variations of the Lambert projection were created to suit different geographic regions and purposes. One common variation is the Lambert Conformal Conic projection, which is widely used in cartography.
- Application in Cartography: The Lambert projection and its variations have been widely adopted in cartography for creating maps of various regions, including large portions of continents and entire countries. The projection is used for its ability to accurately depict shapes and areas within a specified zone while minimizing distortion.
- Adoption in Geographic Information Systems (GIS): With the advent of computers and Geographic Information Systems (GIS) in the 20th century, the Lambert projection and other map projections became an integral part of digital mapping and geospatial analysis. They are used for creating accurate maps and performing spatial analysis.
The Lambert projection continues to be used today in various forms, and it is especially popular in Europe for mapping purposes. It is just one of many map projections available, and the choice of projection depends on the specific needs of a mapping project and the region being represented.
Keep in mind that map projections are mathematical methods for representing the three-dimensional Earth on a two-dimensional map, and each projection has its own strengths and weaknesses depending on the purpose of the map and the area of interest.


 Author: Kirill Shrayber, Ph.D. FRGS