Street Network as a Graph
Nodes, Edges and Why Road Topology Determines Map Quality
If geodata preparation is the foundation,
the street network is the structural skeleton.
Remove buildings.
Remove land use.
Remove labels.
What remains?
The road graph.
And that graph defines how the city works.
What Is a Street Network Graph?
In mathematical terms, a graph consists of:
-
Nodes — connection points
-
Edges — connecting segments
In cartography:
-
Node = intersection
-
Edge = road segment between intersections
This is not theory for academics.
If your road graph is wrong, your map will be wrong.
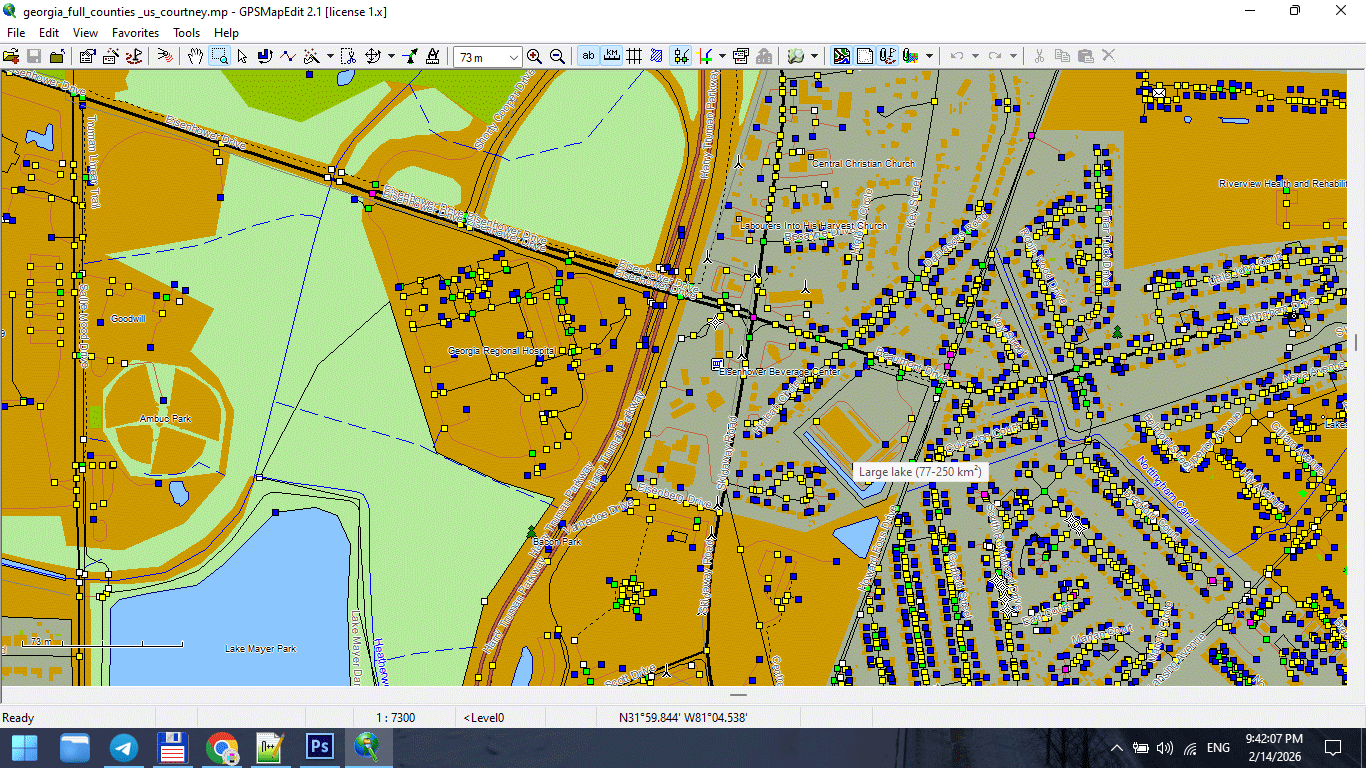
Figure 1. Street Network Nodes at Road Intersections.
Why Graph Structure Matters in Print Maps
Broken topology leads to:
-
Visual gaps
-
Misaligned intersections
-
Duplicate strokes
-
Confusing overlaps
-
Incorrect road hierarchy
Even if the map looks “fine” at first glance,
errors appear during:
-
Generalization
-
Stroke hierarchy styling
-
Illustrator export
-
Large-format printing
Road topology is not decoration.
It is infrastructure.
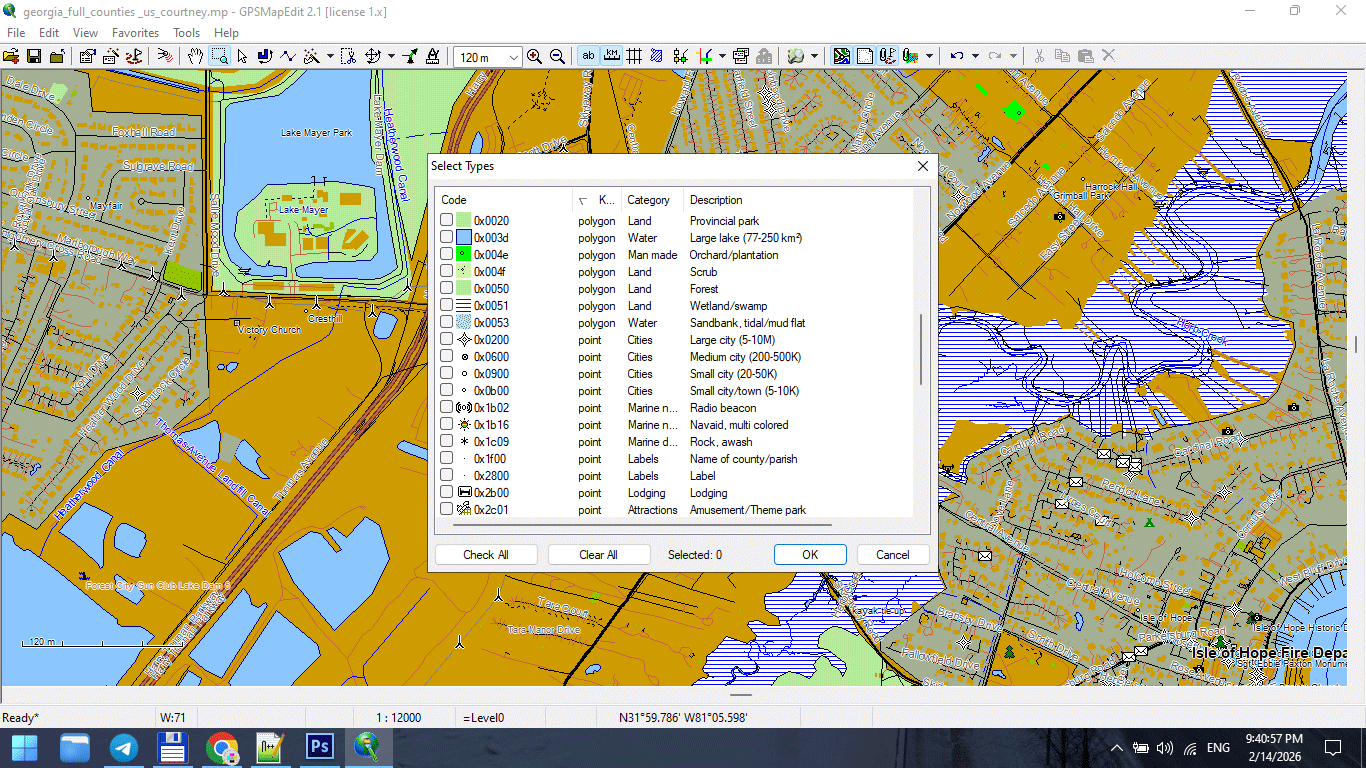
Figure 2. Road Segments (Edges) and Direction Attributes.
Common Street Network Problems
Raw datasets often contain:
1. Broken Intersections
Two roads visually cross
but are not actually connected in geometry.
This causes:
-
Direction inconsistencies
-
Gaps during styling
-
Incorrect hierarchy rendering
2. Duplicate Segments
Same road stored twice.
Results:
-
Double-thick strokes
-
Export glitches
-
File weight inflation
3. Multi-Segment Chaos
One road broken into dozens of small segments
with inconsistent attributes.
Results:
-
Labeling problems
-
Stroke inconsistency
-
Editing frustration
4. Incorrect Classification
Primary road marked as residential.
Service road marked as trunk.
If classification is wrong:
Layer hierarchy fails.
Road Classification Hierarchy
For most city maps, classification typically follows:
-
Motorway / Highway
-
Primary roads
-
Secondary roads
-
Tertiary roads
-
Residential streets
-
Service roads
-
Footpaths
Do not blindly trust imported classifications.
Verify visually against satellite imagery or reliable reference.
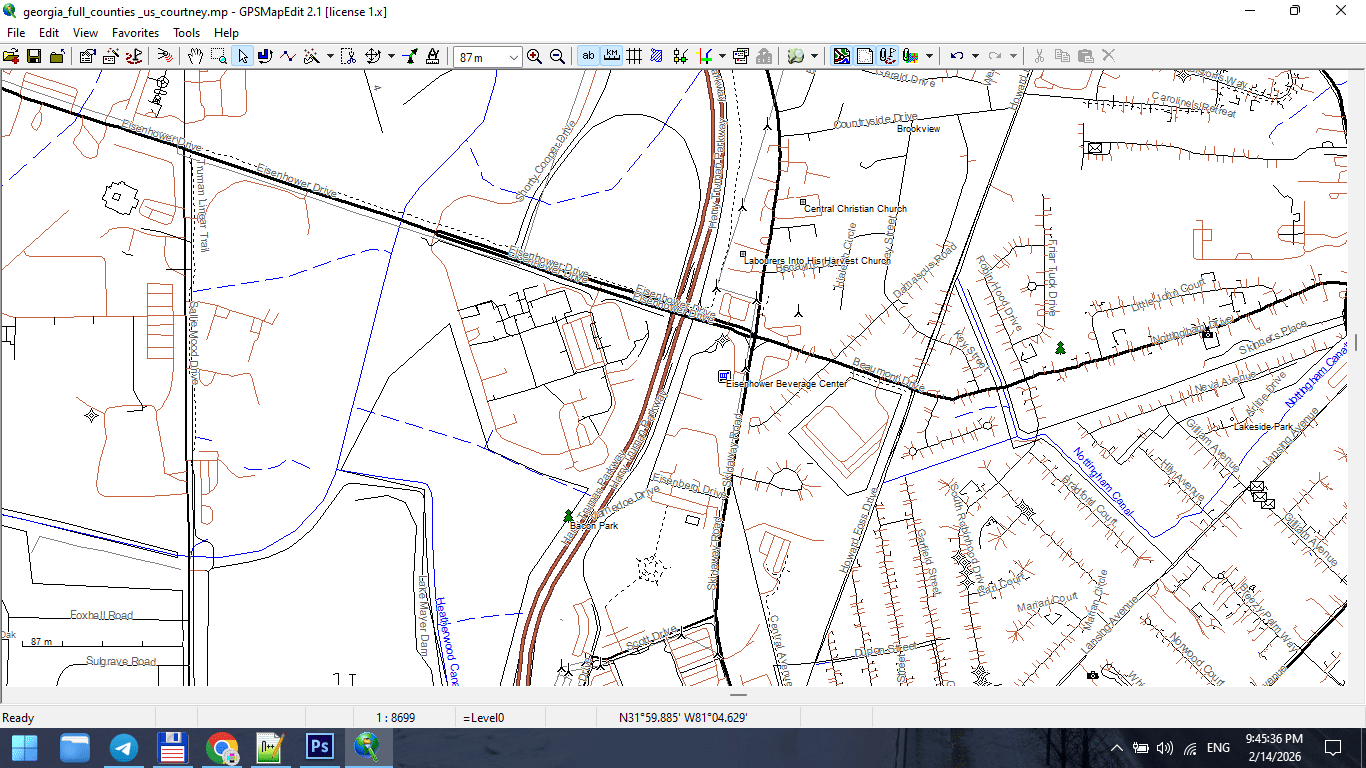
Figure 3. Urban Road Classification Hierarchy.
Nodes and Intersection Logic
In a correct graph:
-
Intersections share a common node
-
Lines meet precisely
-
No micro-gaps exist
-
No overlapping duplicates remain
Micro-gaps may not be visible at normal zoom,
but they break topology.
They also create print artifacts.
Zoom aggressively. Inspect carefully.
Directionality and One-Way Logic
Some datasets store:
-
One-way attributes
-
Direction flags
-
Traffic hierarchy
Even if your print map does not show arrows,
this information helps:
-
Validate road consistency
-
Detect classification errors
-
Identify duplicates
Ignoring attributes entirely is a mistake.
When to Simplify the Graph
Before full generalization (covered in Chapter 6),
basic structural cleanup is necessary:
-
Merge unnecessary segments
-
Standardize classifications
-
Remove irrelevant road types
-
Correct intersections
Do not aggressively simplify yet.
First: fix structure.
Later: reduce geometry.
Graph as the Structural Backbone of the City
Try this thought experiment:
Imagine you strip a city down to just:
-
Roads
-
Bridges
-
Railways
You would still recognize the city.
The street network defines:
-
Density
-
Flow
-
Spatial rhythm
-
Urban character
That is why graph integrity is critical.
Visual Hierarchy Begins Here
Layer hierarchy (Chapter 4) depends on:
Correct classification.
If the graph is structurally wrong,
styling cannot save it.
No color palette can fix broken topology.
Advanced Check: Intersection Density
For advanced beginners:
Examine:
-
Too many tiny segments?
-
Excessive node density?
-
Unnecessary subdivision?
High vertex density:
-
Slows processing
-
Complicates generalization
-
Increases file size
Graph cleanup improves:
-
Performance
-
Stability
-
Print quality
Professional Workflow Rule
Never export raw OSM roads directly into Illustrator.
Always:
-
Inspect graph
-
Correct intersections
-
Standardize classification
-
Remove noise
-
Save cleaned version
Illustrator is for design.
Graph logic belongs in GIS.
What a Clean Street Graph Should Look Like
Before moving forward, your road network should:
-
Have no broken connections
-
Have no duplicate segments
-
Have consistent classification
-
Be logically segmented
-
Have manageable vertex density
-
Be CRS-aligned
If these conditions are met,
you are ready to build cartographic hierarchy.
Summary
A city is a graph.
If the graph is broken:
-
The map is unstable
-
Styling fails
-
Printing suffers
If the graph is clean:
-
Hierarchy becomes logical
-
Generalization becomes controlled
-
Export becomes stable
The road network is not just one layer.
It is the structural backbone of your entire map.
Next Chapter
Now that the structural skeleton is clean,
we can build visual logic on top of it.
→ Chapter 4 — Cartographic Layer Hierarchy and Visual Structure
Go to Start Page: Technology of Vector Map Production
Frequently Asked Questions
What is a street network graph?
A street network graph represents roads as edges and intersections as nodes.
Why is topology important in cartography?
Topology ensures correct connections between roads and boundaries. Broken topology causes printing and styling issues.
How do I detect duplicate road segments?
Zoom in, inspect overlapping strokes, and validate attributes in GIS before export.
Should I fix road classification errors?
Yes. Correct classification is essential for proper visual hierarchy.
Table of contents
Chapter 1 — What Is a Vector Map?
Chapter 2 — Obtaining and Preparing Geodata (SHP, OSM, GeoJSON)
Chapter 3 — Street Network as a Graph (Nodes and Edges Explained)
Chapter 4 — Cartographic Layer Hierarchy and Visual Structure
Chapter 5 — Map Projections and Why Distortion Is Inevitable
Chapter 6 — Map Generalization and Scale Control
Chapter 7 — Vector Formats: SHP, GeoJSON, AI and PDF
Chapter 8 — Professional Map Production Workflow
Chapter 9 — Preparing a Vector Map for Print in Illustrator
Chapter 10 — Common Mistakes in Vector Map Production
 Author: Kirill Shrayber, Ph.D. FRGS