Obtaining and Preparing Geodata
SHP, OSM, GeoJSON and the First Critical Steps in Map Production
If Chapter 1 explained what a vector map is,
this chapter explains where the real work begins.
Professional map production does not start in Illustrator.
It starts with raw geodata.
And raw geodata is almost never clean.
Where to Get Vector Geodata
There are many sources of geographic data. The key is knowing which to trust — and how to combine them.
1. OpenStreetMap (OSM)
One of the most widely used global datasets.
Advantages:
-
Global coverage
-
Frequent updates
-
Free and open
Limitations:
-
Inconsistent quality across regions
-
Community-maintained (not always standardized)
-
Often overloaded with unnecessary attributes
You can extract data via:
-
Direct regional downloads
-
Overpass API
-
Pre-packaged extracts (Geofabrik, etc.)
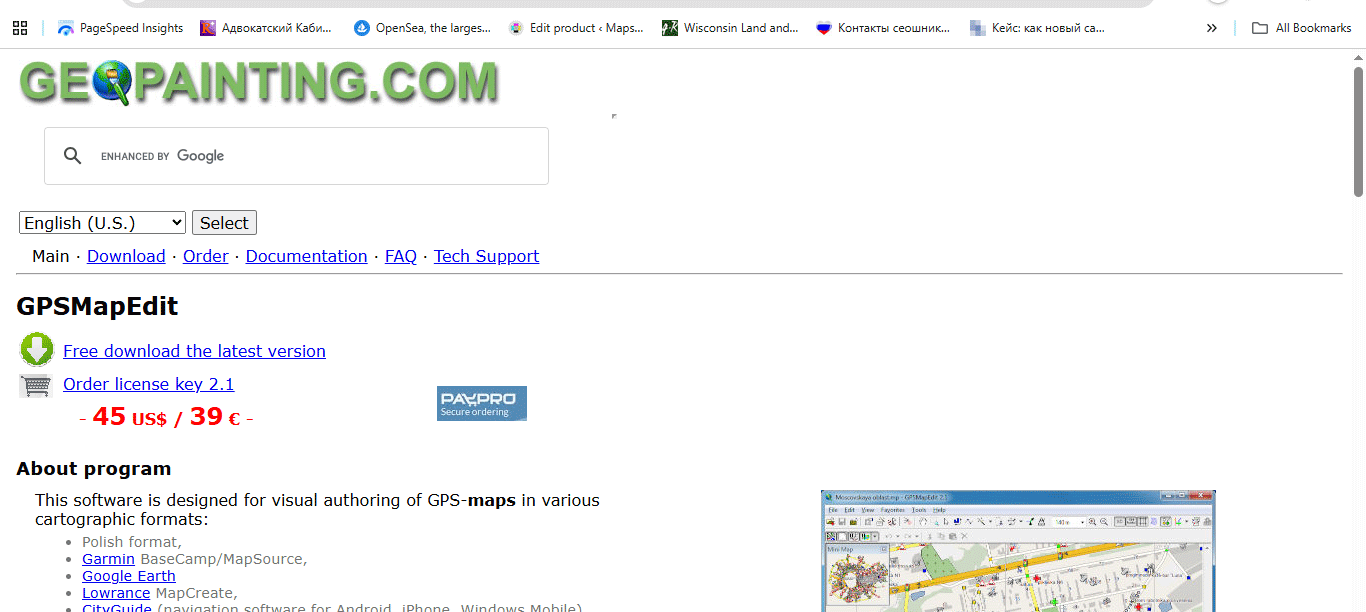
Figure 1. Where to Get Vector Geodata.
2. Government Open Data Portals
For many countries, official data is more reliable than OSM.
Typical datasets:
-
Road networks
-
Administrative boundaries
-
Postal codes
-
Land parcels
-
Building footprints
Government data is often:
-
More standardized
-
Better classified
-
Topologically cleaner
But:
-
Licensing must always be checked.
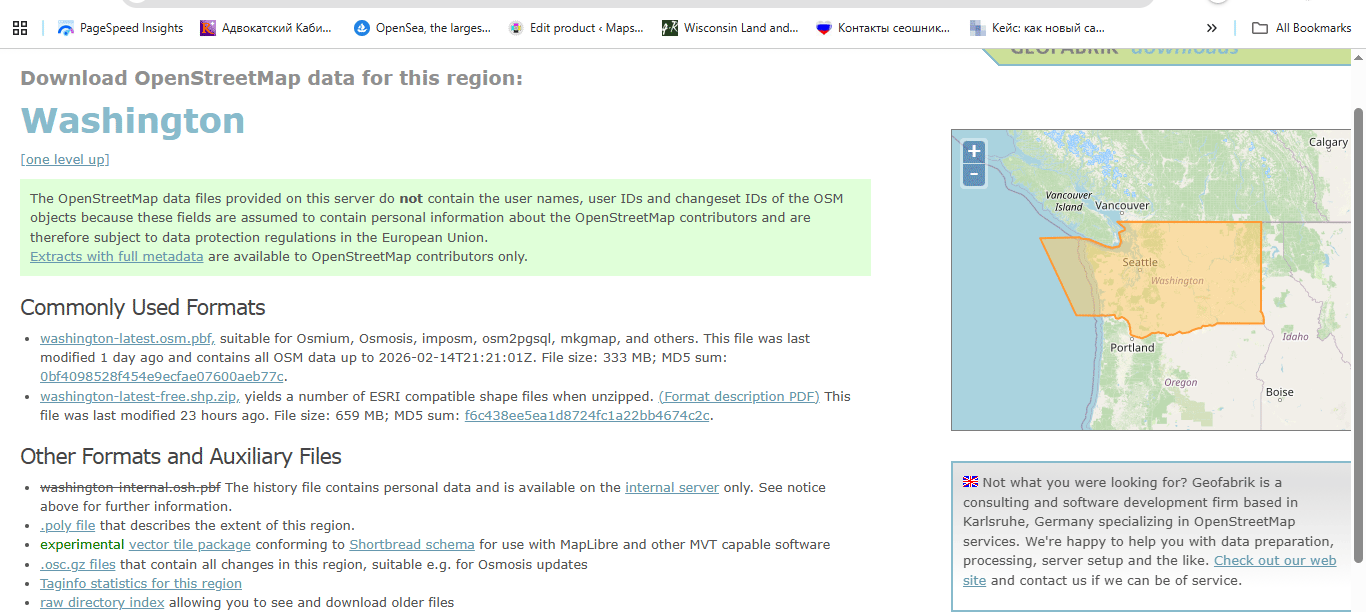
Figure 2. Where to Get Vector Geodata 2.
3. Commercial Data Providers
In some projects (especially infrastructure or logistics),
commercial datasets may be necessary.
They are:
-
Structured
-
Professionally maintained
-
Often expensive
Use them when precision matters.
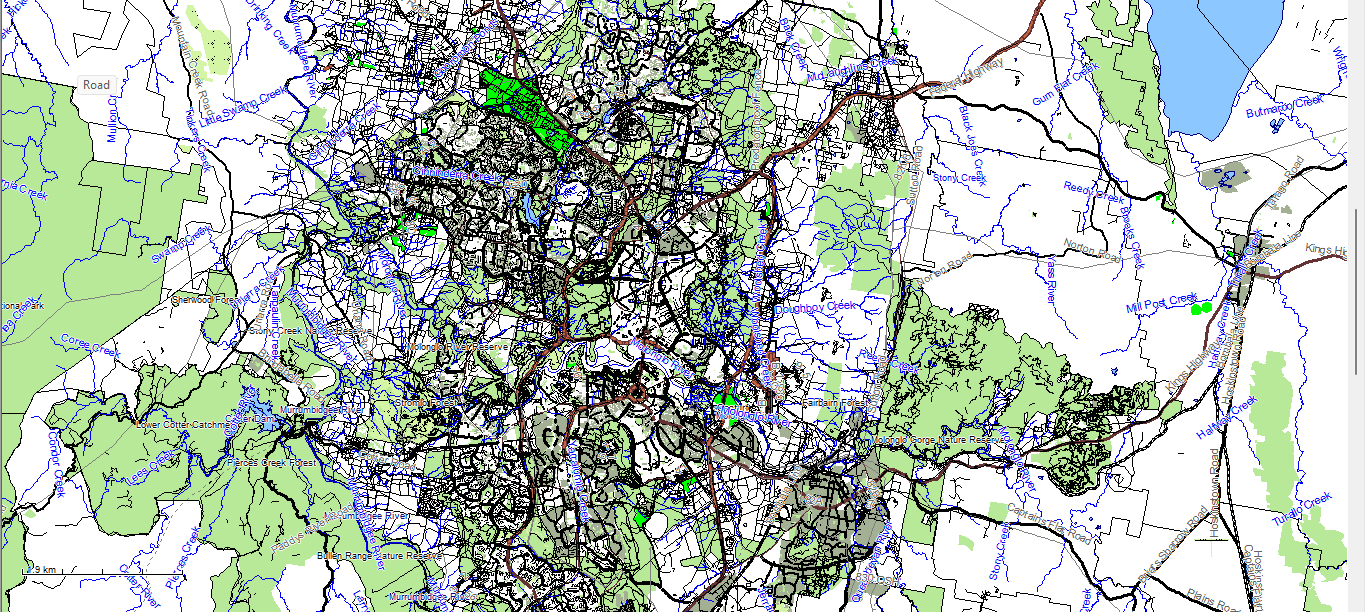
Figure 3. Where to Get Vector Geodata 3 – raw downloaded geodata in MapEdit.
Never Use Only One Source
This is a critical rule.
Different sources contain different strengths:
-
OSM → good street detail
-
Government datasets → accurate boundaries
-
Satellite imagery → reality check
-
Local municipal data → high precision
Professional production often requires merging multiple sources into one coherent structure.
Common Geodata Formats
Before cleaning, you must understand the format you are importing.
Shapefile (SHP)
A classical GIS format consisting of multiple files:
-
.shp— geometry -
.shx— geometry index -
.dbf— attribute table -
.prj— projection -
sometimes
.cpg,.qix, etc.
Important:
Shapefile is not a single file.
It is a structured dataset.
Advantages:
-
Industry standard
-
Widely supported
-
Stable for production workflows
Limitations:
-
Attribute name length restrictions
-
No complex topology support
-
Multiple-file structure
GeoJSON
A text-based format.
Advantages:
-
Single file
-
Human-readable
-
Ideal for web usage
Limitations:
-
Large file sizes
-
Not optimized for heavy production
-
No indexing
GeoJSON is excellent for web mapping.
For large production maps, it is usually an intermediate format.
Step 1: Verify the Coordinate Reference System (CRS)
Before doing anything else:
Check the CRS.
Common coordinate systems:
-
WGS84
-
Web Mercator
-
Local projected systems
If you combine datasets with different CRS without reprojecting them properly:
-
Roads shift
-
Boundaries misalign
-
Buildings float
-
Printing becomes impossible
Golden rule:
Never work in mixed projections.
Always align CRS at the beginning.
Step 2: Inspect Raw Data Quality
Raw datasets almost always contain problems.
Typical issues:
-
Duplicate geometries
-
Broken line segments
-
Micro-gaps in polygons
-
Overlapping boundaries
-
Incorrect classifications
-
Excessive attributes
-
Redundant POI points
Before design begins, the dataset must be cleaned.
Step 3: Remove What You Do Not Need
One of the biggest beginner mistakes:
Keeping everything.
For a print city map, you usually do NOT need:
-
Every POI
-
Service driveways
-
Temporary objects
-
Internal parcel divisions
-
Minor footpaths (depending on scale)
Overloaded data produces:
-
Heavy files
-
Slow processing
-
Visual chaos
Cartography is selective.
Remove noise early.
Step 4: Clean and Standardize Attributes
Attribute tables often contain:
-
Inconsistent naming
-
Mixed language labels
-
Empty fields
-
Redundant columns
For example:
One dataset may use:
-
highway = primary
Another:
-
road_type = major
Standardize classifications early.
Otherwise your layer hierarchy later becomes unmanageable.
Step 5: Correct Street Network Structure
Even before formal topology cleaning, inspect:
-
Broken road connections
-
Misaligned intersections
-
Duplicated line segments
-
Incorrect direction flags
The street network is the structural backbone of most city maps.
If the graph is broken, everything built on top will be unstable.
We will cover full graph logic in Chapter 3.
Step 6: Save Clean Intermediate Versions
Professional workflow always includes version control.
Example structure:
city_clean_v2.shp
city_standardized_v3.shp
city_generalized_v4.shp
Never overwrite the original dataset.
You may need to return to it later.
Common Beginner Mistakes in Data Preparation
-
Mixing coordinate systems
-
Editing without saving versions
-
Ignoring attribute cleanup
-
Trusting one data source
-
Importing directly into Illustrator without GIS cleaning
Illustrator is not a GIS cleaning tool.
Data must be prepared before design begins.
What Clean Geodata Should Look Like
Before moving to the next stage, your dataset should:
-
Have a unified CRS
-
Contain only relevant object types
-
Have standardized classifications
-
Be free from obvious duplicates
-
Be topologically consistent
-
Have manageable file size
If this stage is done correctly,
the rest of the workflow becomes stable.
If not — you will suffer later.
Summary
Obtaining geodata is easy.
Preparing geodata is professional work.
Professional vector map production begins with:
-
Careful source selection
-
CRS alignment
-
Data cleaning
-
Attribute standardization
-
Structural validation
Only after this foundation is solid
can real cartographic design begin.
Next Chapter
Now that the data is clean,
we move to the structural backbone of every city map:
→ Chapter 3 — Street Network as a Graph (Nodes and Edges Explained)
Go to Start Page: Technology of Vector Map Production
Frequently Asked Questions
Where can I download shapefiles (SHP)?
Shapefiles are available from OpenStreetMap extracts, government open data portals, and commercial geodata providers.
What is CRS in GIS?
CRS (Coordinate Reference System) defines how geographic coordinates are mapped onto a flat surface. All layers must share the same CRS.
Can I skip data cleaning before design?
No. Raw geodata contains structural errors and unnecessary attributes that must be cleaned before production.
Is GeoJSON suitable for large print maps?
GeoJSON is ideal for web applications but usually not optimal for heavy large-format print production.
Table of contents
Chapter 1 — What Is a Vector Map?
Chapter 2 — Obtaining and Preparing Geodata (SHP, OSM, GeoJSON)
Chapter 3 — Street Network as a Graph (Nodes and Edges Explained)
Chapter 4 — Cartographic Layer Hierarchy and Visual Structure
Chapter 5 — Map Projections and Why Distortion Is Inevitable
Chapter 6 — Map Generalization and Scale Control
Chapter 7 — Vector Formats: SHP, GeoJSON, AI and PDF
Chapter 8 — Professional Map Production Workflow
Chapter 9 — Preparing a Vector Map for Print in Illustrator
Chapter 10 — Common Mistakes in Vector Map Production
 Author: Kirill Shrayber, Ph.D. FRGS