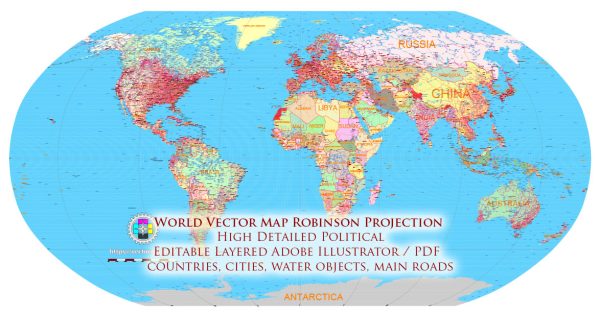
The Robinson projection is a type of map projection that was developed by American geographer Arthur H. Robinson in 1961. It’s a compromise projection that attempts to minimize distortion of size, shape, and distance across the entire world map. It’s often used for world maps because it strikes a balance between various types of distortion, making it visually appealing and relatively accurate for general reference. Here’s a general description of the Robinson projection and how it relates to time zones:
- Shape: The Robinson projection does a decent job at preserving the overall shapes of continents and countries, although there is some distortion towards the poles.
- Size: This projection reduces the distortion of size, but there’s still noticeable distortion in the polar regions and at the equator. Countries and regions near the equator are represented more accurately in terms of size than in many other projections.
- Distance: The Robinson projection tries to minimize distortion of distance, but as with any projection, there are still some inaccuracies, especially as you move away from the equator and towards the poles.
Regarding time zones, the Robinson projection does not inherently display time zones; it’s a map projection that focuses on preserving the shapes and sizes of continents and countries. However, time zones are a geographical concept that can be superimposed on any map projection. Here’s how time zones work and how they relate to maps:
- Time Zones: The Earth is divided into 24 time zones, each roughly 15 degrees of longitude wide. Time zones are primarily based on the Earth’s rotation. As you move eastward from the Prime Meridian (0 degrees longitude) near Greenwich, UK, you add hours, and as you move westward, you subtract hours. Each time zone usually differs from its neighboring time zones by one hour.
- Superimposing Time Zones: On a Robinson projection map or any other map, you can add time zone boundaries and labels to show the time difference between different regions. Time zones are usually indicated by lines that follow lines of longitude, with the standard time of the zone labeled.
For example, Eastern Standard Time (EST) in the United States is in the UTC-5 time zone. So, on a map, you might draw a boundary that indicates the Eastern Time Zone and label it as UTC-5. As you move westward, you would find the Central Time Zone (UTC-6), Mountain Time Zone (UTC-7), and Pacific Time Zone (UTC-8), and so on.
Keep in mind that some regions, like India, Newfoundland, and parts of Australia, have time zones that deviate from the standard one-hour intervals because they adjust for local or political reasons. Additionally, daylight saving time is not always accounted for on maps and may need to be considered when calculating the current local time in a specific area.


 Author: Kirill Shrayber, Ph.D. FRGS