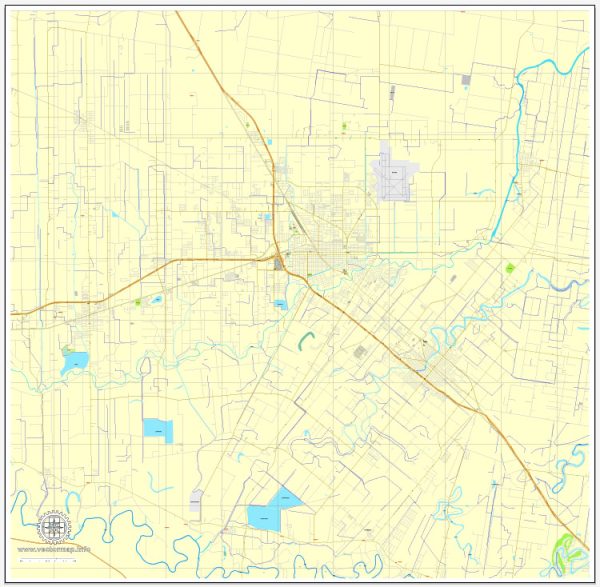
General demographic information about Harlingen, Texas. Here are some key demographic statistics for Harlingen, Texas:
- Population: In 2023, the U.S. Census Bureau reported that the population of Harlingen, Texas, was approximately 65,520. Keep in mind that this number may have changed since then.
- Age Distribution: Harlingen has a diverse age distribution, with residents of all age groups. It includes a significant portion of both younger and older individuals.
- Ethnic and Racial Diversity: Harlingen, like many cities in Texas, is known for its diversity. The population includes people of various ethnic and racial backgrounds, with a significant Hispanic or Latino population.
- Education: Harlingen is home to several educational institutions, including public schools and a university. Educational attainment levels among the population vary, with a range of educational backgrounds.
- Employment and Industry: The local economy in Harlingen is diverse, with employment opportunities in healthcare, agriculture, education, and various other industries. Harlingen Medical Center is one of the city’s major employers.
- Housing: Harlingen has a mix of housing options, including single-family homes, apartments, and condominiums. Housing costs can vary based on factors like location and property type.
- Income: Income levels in Harlingen can vary, with some residents earning higher incomes, particularly in professions like healthcare and education, and others with more modest incomes.
- Health Care: Harlingen is known for its healthcare facilities and services, making it a regional hub for medical care in the Rio Grande Valley.
- Immigration: Like many cities in Texas, Harlingen has a diverse population with immigrants from various countries. This diversity contributes to the cultural richness of the city.
- Cultural Attractions: Harlingen has cultural attractions, events, and festivals that reflect the diversity of its population, including celebrations of Mexican culture and traditions.


 Author: Kirill Shrayber, Ph.D. FRGS